Basic Science
| Title | The Structure and dynamics of groundwater systems in northwestern India under past, present and future climates |
|---|---|
| Participants | Dewashish Kumar, Setbandhu Mondal, V.S. Sarma and Mrinal K. Sen |
| Sponsoring Agency | MOES – Grant-in-Aid |
Work Description:
Introduction
Even the minute variation in the resistivity of the subsurface formations related to sand/soil texture, moisture content and porosity variation can be mapped in terms of resistivity values and contrast. The presence of buried channel (dry and hard sand formation) is very well resolved from the present 2D resistivity tomography dataset. The discontinuity within the buried channel is clearly visible from the inverted 2D resistivity sections as revealed from the results at different sites. These channels are possibly the indicators of groundwater reserves and could be exploited – a precious resource as and when on demand and need.
Study Area
Geology and Geomorphology
The Ghaggar river basin covers an area of about 42,200 km2 extending over parts of several states in northwestern India namely Haryana, Himachal Pradesh, Punjab, Rajasthan and the Union territory of Chandigarh (fig.34.1). The Ghaggar basin is a part of the large Indo-Gangatic Quaternary basin, which is filled with many hundreds of meters of alluvial deposits. The Ghaggar is mainly a rainfed river and it carries base flow throughout the year only in its upper reaches. It flows across the basin for a distance of 560 km from the Siwalik Hills, through the states of Haryana, Punjab and Rajasthan to the flood plain and natural depressions in the south-west part of the basin. The Markanda and Dangri rivers meet the Ghaggar near Tatiana. The mean temperature is between 37oC and 45oC.
Materials and Methods
In the present study, ERT investigaton was carried out at 18 profilesalong11.34 km line across the Ghaggar river system of northwestern India. The resistivity field data is first processed for eliminating any noisy or bad data points in the gathered data set and later depending on the smoothness of resistivity data damping and mesh parameters had been assigned to the individual data set in order to achieve realistic subsurface resistivity models. The processed and filtered data is inverted using least squares inverse approach with smoothness constrained (Sasaki, 1992; Loke, 1997, 1997a) and with a standard Gauss-Newton optimization technique using Res2DINV software. This actually reproduces an approximate subsurface resistivity variation with depth both in lateral and vertical direction. The inverted 2D resistivity section, which is an approximation to the subsurface formation resistivity in turn finally is interpreted in terms of geology, structure and hydrogeology in the present hydrogeological context.
Interpretation of 2D Electrical Resistivity Tomography Dataset
Profile -TN-3
2D inverted resistivity model shows uniform variation in resistivity of the subsurface lithological units (fig.34.2). The model shows thick band of compact sand with a resistivity of 300-500 Ohm.m at a depth of 20m, which is comparatively thicker in eastern side. This confined aquifer is clearly delineated at a depth of ~55 m (fig.34.2) showing potential aquifer of sand saturated with water with resistivity of the order of 10-35 Ohm.m.
Profile - KA-2
The inverted resistivity model shows hard sand layer (light brown to red layer) with a resistivity range of 170-500 Ohm.m at 25m depth. This clearly indicates the presence of buried palaeochannel throughout the section, which might be active and productive in the past but at present acting as a hard sand layer (fig.34.2). This layer is overlain by the younger sediments which act as an active channel source in the shallower part of the alluvium formation. This is subsequently followed by fine sand/silt and then medium sand layer with variation in texture of sand and moisture content of the formation. The large dimension of aquifer system within sandy formation (sky blue to blue colour) is clearly delineated at a depth of 70m, which is fully saturated with water (fig.34.1) and is under confined condition.
Discussion on results of 2D resistivity dataset
2D resistivity sections in and around Punjab and Haryana of northwest India revealed that the subsurface consists of sedimentary formations underlain by 6 to 7 major stratified layers. But at a few sites, the layers are highly disturbed and are quite heterogeneous in nature signifying the palaeochannel signature and meandering nature. The alternate bands of sand and silty layers of varying thickness are delineated from the 2D inverted resistivity models.
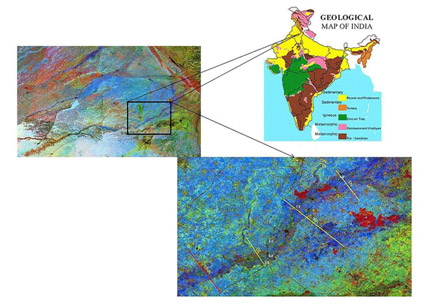
Fig.34.1:
Figure showing the landsat imagery showing near surface palaeochannel in alluvium aquifer of the Ghaggar river system in Northwestern India : Yellow lines are the 2D resistivity tomography profiles across the palaeochannel
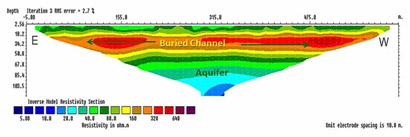
Fig.34.2:
Shows the 2D inverted resistivity section along Tatiana Site (TN -3) with clear cut buried channel anomaly with consistent thickness and its lateral extension along with the aquifer zone
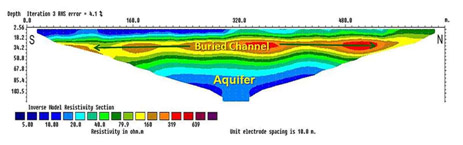
Fig.34.3:
Shows the 2D inverted resistivity section along Kasaur Site (KA -2) delineating the buried channel anomaly with variable thickness and its lateral extension along with the aquifer zone