Basic
| Title | Low shear velocities in the sub-lithospheric mantle beneath the Indian shield? |
|---|---|
| Participants | M. Ravi Kumar, Dipankar Saikia, Arun Singh, D. Srinagesh |
| Sponsoring Agency | CSIR-NGRI |
Work Description:
Ever since its breakup from the Gondwanaland ~140 Myr ago, the Indian plate was ravaged by four hot spots. Although the surface manifestations of such deep processes are evident in terms of large igneous provinces like the Deccan and the fast drift of the Indian plate, the modifications to the deep structure remain to be grasped. In this study, we investigate the mantle transition zone (TZ) structure beneath the Indian shield region using ~14,000 teleseismic receiver functions from 77 broadband stations sited on diverse geologic terrains (Fig. 1.1). The arrival times of the P-to-s (Ps) conversions from the 410 km discontinuity at most cratonic stations appear to be delayed by ~2 s in comparison with the times observed for other Precambrian shield regions like Africa, Australia, and Canada Such delays in the conversions from the 410 km discontinuity below the Indian shield suggest low shear wave speeds in the lithospheric and sub-lithospheric mantles due to higher temperatures, together with a thinner high velocity lid that contrasts with a thicker one found beneath most Archean cratons. A thin transition zone beneath most of the cratonic stations lends support to the enhanced temperatures within the TZ itself. Also, a further delay of the TZ discontinuities is observed for stations on the southern granulite terrain, which was under the influence of the Marion plume that is responsible for the separation of Madagascar from India. Although the data do not conclusively show evidence for a 520 km discontinuity, an LVL atop the 410 cannot be ruled out beneath certain geological provinces of the Indian shield.
 Fig.1.1:
Location of the 77 broadband stations used in this study, superimposed on the surface geology of India. Stations SHL, AKL, and AJMR (labeled in blue) reveal a low velocity layer atop 410. AB and CD are the profiles along which the receiver function sections at individual stations are presented
| Title | Seismogenesis of the Indian Shield |
|---|---|
| Participants | R K Chadha, D V Ramana, M.Shekar, Narendra Kumar and A.P.Shankar |
| Sponsoring Agency | CSIR-NGRI |
Work Description:
CODA WAVE ATTENUATION IN SOUTHERN INDIAN SHIELD
Seismic attenuation studies were carried out using 10 Broadband seismological data in the Indian Peninsular shield to improve our understanding of the seismic attenuation characteristics for better evaluation of the seismic hazards in the region. The Indian shield has experienced six damaging earthquakes of M 5.4-7.7 in the recent past. About 400 local earthquakes of M 2.5-4.0 within an epicentral distance of 250km are used in this study (Fig.2.1).
The broadband seismic stations are located in different geological provinces, such as the Archaean Dharwar craton, the southern granulite terrain, the Proterozoic Cuddapah basin, the Godavari graben, the Cretaceous-Eocene Deccan volcanic province and in the Cambay basin. This allowed us to understand the variations of Q0 in terms of spatial variations obtained in different geologic and tectonic provinces (Table 1).
The results reflect a ubiquitous observation of frequency dependence of Qc in the different geologic provinces. While the rift basins exhibit lower Q0, suggesting higher attenuation due to a more heterogeneous structure, higher Q0 in the western Dharwar craton indicates lower attenuation. Similarly, the Deccan volcanic province is characterized by significantly higher Q0. The results show a good correlation with the observed heat flow values in the region. The study fills an important gap in knowledge about the Q factor as well as of crustal attenuation conditions in the whole southern peninsular Indian shield.
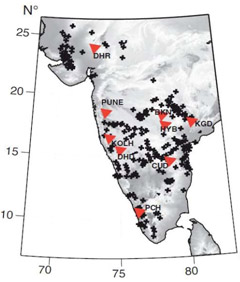
Fig.2.1:
Epicenter map of the events used for the analysis of Coda Q attenuation. Inverted triangles represent broadband seismic station locations.
| Stations | Coda Q0 Value |
|---|---|
| Bhikanoor | 268 ± 55 |
| Hyderabad | 254 ± 21 |
| Dharwad | 342 ± 41 |
| Peechi | 290 ± 54 |
| Cuddapah | 440 ± 40 |
| Dharoi | 288 ± 20 |
| Pune | 316 ± 25 |
| Kothagudem | 249 ± 46 |
| Kolhapur | 594 ± 25 |
Total : Q0 obtained for different stations in the Indian shield
| Title | PROGNOSTIC ANOMALIES OF INDUCED SEISMCITY OBSERVED IN KOYNA-WARNA REGION |
|---|
Work Description:
2000, the region of the Koyna–Warna water reservoirs in Western India was hit by two strong earthquakes, which occurred six months apart with magnitudes M > 5. The Koyna–Warna seismic zone is a typical region of induced seismicity with a pronounced correlation between seismicity and water level variations in the reservoirs. This indicates that the stress level in the region is close to critical; thus, insignificant variations in stress caused by the variations in the water level may trigger a strong earthquake. In order to study the preparatory processes in the sources of the induced earthquakes, we analyzed q, d and b-values and RTL parameters in the earthquake catalogue for Koyna–Warna region from 1964 to 2006 (Fig.3.1).
The induced seismicity is found to exhibit prognostic variations in these parameters which are typical of preparation of tectonic earthquakes and indicative of the formation of metastable source zones for future earthquakes. Based on the obtained results, we suggest that initiation of failure in these metastable zones within the region of induced seismicity could have been caused by the external impacts associated with water level variations in the reservoirs and by the internal processes of avalanche unstable crack propagation.
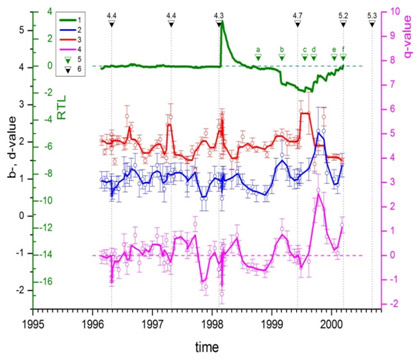
Fig.3.1:
The time variations in (1) RTL, (2) d_value, (3) b_value, and (4) q_value. The initial estimates (the points) and the smoothed curves are shown. The horizontal dashed lines are the zero levels for RTL and q_value. The RTL variations are calculated for the epicentral areas of the strong earthquakes.
| Title | To record variations and absolute values of the Earth’s magnetic field, over an extended time to study changes of the Earth’s magnetic field and its correlations with external and internal sources |
|---|---|
| Participants | Kusumita Arora, S.R.Sannasi, K.C.S Rao, L.Manjula, C.H.Gattaih, N.Phani Chandrasekhar |
| Sponsoring Agency | CSIR-NGRI |
Work Description:
Definitive data for the year 2011 was finalized and submitted to INTERMAGNET. The three component baseline data is processed to be consistent and continuous with international baseline values. Data reporting for national publication has also been sent to IIG, Mumbai. 1 min quasi-definitive data on a monthly basis, has been submitted to INTERMAGNET for real time analyses by global community for the year 2011.
The baseline values of the Observatory for the entire year along with K indices for the year 2011 are shown in Fig 4.1. The standard deviations of the baselines are 1.5 nT for H component, 0.24 min for D component, 1.3 nT for Z component, despite increasing deterioration of the magnetic environment in the vicinity of the Observatory due to cultural noise. The K indices chart is a visual representation of the influence of solar activity on magnetic variations. The maximum K values of 6 were recorded on 23 April, 17 June and 14 July 2012, corresponding to solar storms with sunspot numbers of 89, 62, 83, respectively. The five most Disturbed Days are 17 June, 15 July, 3Sept & 14 Nov, 2012, and 17 January, 2013. We recorded a Type A storm on 14 July 2012 where the SC amplitude picked up by 32 nT within a few minutes. During peak storm period, amplitude of H component rose upto 245 nT. The minimum K value is 0. The best International Quiet days occurred on 4, 20 and 30 Oct and 5 and 31 Dec 2012.
The historical magnetic variation data for the last three decades (hourly values) of the NGRI Magnetic Observatory has been used in conjunction with planetary geomagnetic index and parameters of the solar environment to investigate correlations between sunspot numbers, solar wind, ion density and interplanetary and planetary geomagnetic index (Ap) and local residual measure of magnetic activity (I∆H) for Hyderabad (HYB) low latitude Magnetic Observatory over the period spanning solar cycles 21 – 23 (Fig 4.2).
Studies of magnetic and solar activity at differing time scales, seek to establish the relative contributions of different solar parameters on the former. It is evident that different mechanisms control solar activity over different phases of solar cycles. Temporal variations of Ap have significant divergence from variations in sunspot numbers Rz, although there is a broad overall correlation. The nature of this divergence changes between consecutive solar cycles as well as within a single solar cycle. The influence of other parameters of solar activity is examined. Using wavelet decomposition and correlation coefficients between sunspot numbers, interplanetary parameters and measures of magnetic activity, the complex and time varying nature of these inter-relationships are brought out.
The comparative influence of each parameter eg: Vs or N or Bz at different times and phases of the three solar cycles is clearly brought out by the examination of a new measure of activity (I∆H) and Ap, using scatter plots, correlation coefficients and wavelet analysis. Wavelet decomposition has clarified the structure and signal strength of solar parameters over different phases of solar cycles 21-23 (Fig 4.3). The response of magnetic activity, as measured by I∆H and Ap also evident, although only for certain periodicities: 2.5, 1.3 and 0.5. The time varying nature of influence of these parameters on magnetic activity is also evident. Strong periodic structure of N (5.5 year) is seen in the wavelet analysis. However, it is not reflected consistently in Ap, and even less so in I∆H. The influence of periodic structure in Vs and Rz in cycle 23, however are strongly reflected in Ap and I∆H.
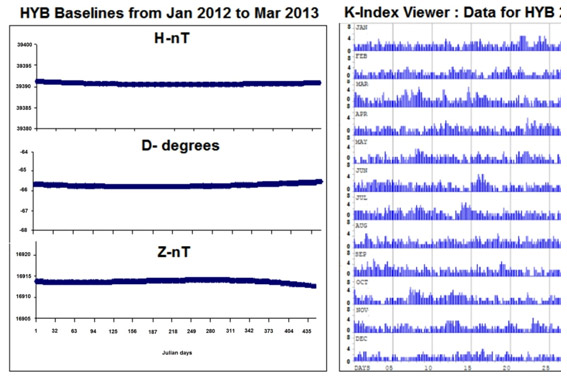
Fig.4.1:
Baseline values of IMO-HYB and K-Indices for the year 2011
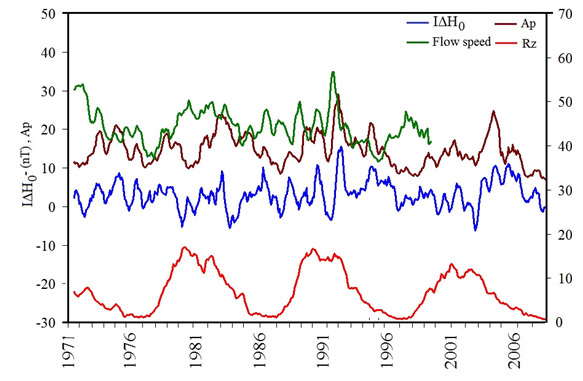
Fig.4.2:
7-point moving average of monthly means of residual field (IΔH0), Ap (magnetic activity), Rz (sunspot numbers) and F10.7 (solar radio flux) for the years 1971-2007.
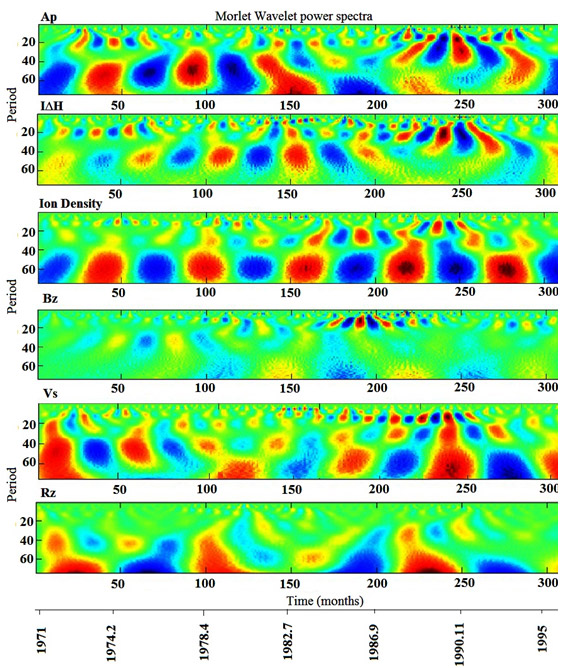
Fig.4.3:
Wavelet power spectra for the periods 5 to 2 years for all the data sets used in the study
| Title | A method for estimating temperature dependence thermal conductivity from temperature dependence thermal diffusivity: A case study on granulites |
|---|---|
| Participants | Labani Ray, Frank Schilling, H.J-.Forster, Andrea Forester |
| Sponsoring Agency | CSIR-NGRI |
Work Description:
Temperature dependent thermal conductivity is an important parameter to constrain crustal geotherm. An indirect method is developed to estimate temperature dependence thermal conductivity of rocks by using (i) temperature dependence thermal diffusivity and (ii) volume percentage of the mineral phases constituting the rocks. Method is described below.
Temperature dependence heat capacity of rocks from its mineral phases can be calculated by
Where CP,i(T) is the heat capacity for each mineral phases at different temperature, T is the temperature in K and vol (i) is the volume fraction for each mineral phases when vol (i) =1. Density of rocks from its mineral phases can be calculated by

Combining the expression (1) and (2), temperature dependence thermal conductivity of the rock samples have been estimated by the expression

Where Drock(T) is the measured thermal diffusivity of the rock at different temperature.
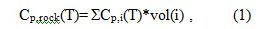
The above method is applied on sixteen granulites and gneisses from the southern Granulite Province, India (Fig 5.1). To estimate volume percentages of the mineral phases of these samples EPMA and XRD studies have been carried out. Results are as follow: (i) Rate of decrease in thermal conductivity with temperature is less (upto 20%) than that of thermal diffusivity (upto 40%). (ii) The rate of decrease in thermal conductivity with temperature and the temperature where thermal conductivity is minimum (Tmin) depends on the radiative component of the thermal conductivity. (iii) Radiative component obtained from this study is found to be different from the study on granulites by Seipold (2001) (Fig5.2). This difference can be attributed to the difference in abundances of the mineral phases and their arrangement in rocks.
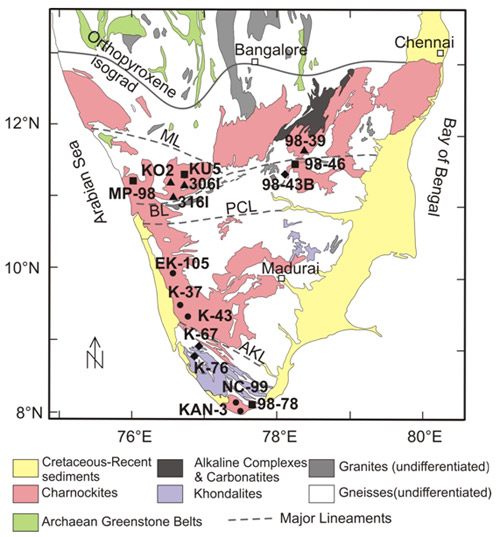 Fig.5.1:
Geological map of the Southern Indian Granulite Province (modified after the Geological Survey of India, 1998). ML: Moyar lineament, BL: Bhavani lineament, PCL: Palghat Cauvery lineament, and AKL: Achankovil lineament. Sample locations of different rock types are shown by different symbols. Charnockites: solid circles, enderbites: solid squares, mafic granulites: solid triangles and gneisses: solid diamonds.
 Fig.5.2:
Plot showing normalized thermal conductivity vs. temperature. Red lines with different symbols show the results of the present study (Ch: charnockite, En: Enderbite, Mg: Mafic granulite, Gn: Gneiss). Grey lines show the results of Seipold (2001) (FG: Felsic granulite, MG: Mafic granulite and GN: Gneiss). Dashed lines show the results of the present study by considering radiative constant C' instead of C. C': 1/8th C for charnockite, C': 1/4th C for mafic granulite, C': 1/5th C for gneiss.
| Title | Electrical structure beneath Schirmacher Oasis, East Antarctica: a magnetotelluric study (D.N. Murthy, K. Veeraswamy, T. Harinarayana#, U.K. Singh*) # GERMI,Gandhinagar * Indian School of Mines, Dhanbad |
|---|
Work Description:
Maitri Station (70.76oS; 11.73oE) is located in Schirmacher Oasis, a coastal nunatak in north central Dronning Maud Land covering an area of 35 km2. These results are from the first magnetotelluric experiment conducted during the 24th Indian Antarctic Scientific Expedition, to delineate the deep electrical conductivity structure under Schirmacher Oasis.
A total of nine tensor soundings in the period range 0.001–1000 s were taken in a profile along the nearly east-west oriented Schirmacher Oasis (Fig. 6a). The16 km in long profile represents a small, but representative domain. Data from two MT sites (8, 9) were not considered for modelling because the data are dominated by noise. MT data have been recorded at only one site on ice cover (MT 7), situated 4 km south of Schirmacher Oasis, for the purpose of experimentation. Use of Titanium electrodes along with Bentonite and salt have helped in achieving a good contact resistance of 300 ohm (100-500 ohm) with the ice cover. Influence of sea water on MT measurements has been computed as the Schirmacher Oasis is at a distance of about 100 km from the coast. Three-dimensional modelling studies conducted in similar situations have shown that the coast effect is stronger in the case of the TM mode than the TE mode. As the present MT sites in Schirmacher Oasis are much farther (ca. 100 km) from the coast, the effects of the same are negligible.
Three-dimensional forward modelling has been performed taking into account the preliminary resistivity and thickness parameters of different layers obtained from two-dimensional inversion. A mesh of 51 x 48 x 33 cells (80784) in north-south, east-west and vertical directions, respectively, was used to compute the forward modelling response. A minimum square error of 10-6 after 200 relaxations with 10 air layers and a convergence factor of 8 have been achieved for the forward model. Sea water (0.25 ohm m) at a distance of 100 km from Schirmacher Oasis has been considered in the modelling. A total of 33 layers (0 to -41 km depth) with representative resistivity values derived from two-dimensional modelling has been used. The magnetotelluric response has been computed at six different locations in Schirmacher Oasis. From the response at site 3 it is evident that the Rho(xy), Phi(xy) and phi(yx) components do not show much variation due to the coast effect. However, the Rho(yx) component shows more than 15% deviation due to the coast effect for the periods more than 100 sec. Hence, two-dimensional inverse modelling has been confined up to 100 sec only.
The 2-D modelling results indicate the presence of a highly resistive (8000 – 10 000 ohm m) upper crust, which shows a lateral variation in thickness from 20 km (below site 6) in the east to 10 km (between sites 1 and 2) in the west (Fig 6 b). It is underlain by a less resistive (500-600 ohm m) lower crust. The highly resistive upper crustal structure supports the existing notion that western Dronning Maud Land is a stable cratonic platform. Results of free-air gravity, seismic, geomagnetic and surface wave dispersion investigations in East Antarctica also indicate a cratonic type crust. The results indicate a westward thinning of the upper crust with a marked boundary between sites 1 and 2. It is also noted that the Mozambique Belt which runs along the east coast of South Africa, Madagascar, Southern India, and Sri Lanka might extend into East Antarctica along a corridor which lies to the west of Schirmacher Oasis and whose eastern boundary appears to be controlled by the fault delineated in the present study.
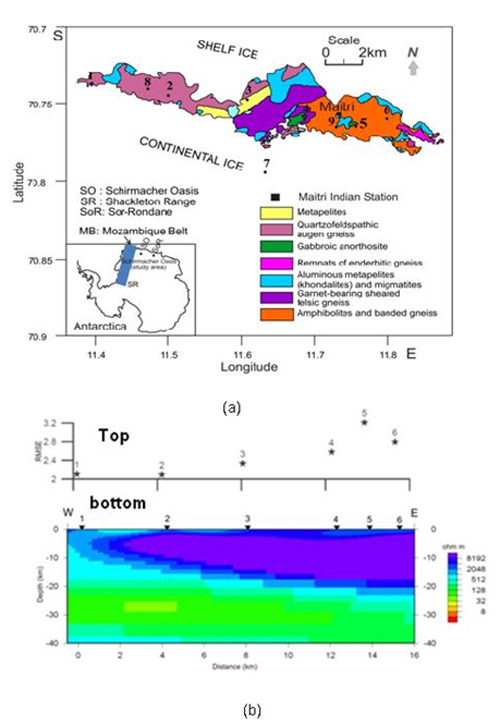 Fig.6(a):
Geological map indicating numbered locations of magnetotelluric investigations in Schirmacher Oasis, East Antarctica. Experimental site 7 (over ice) is not part of the modelled profile. Fig 6 (b). (top) Root mean square error (RMSE) for the sites along the profile after 200 iterations and (bottom) two-dimensional geoelectric resistivity section for Schirmacher Oasis. Transverse electric and transverse magnetic modes have been considered for inversion with TE=YX and τ of 8. The final RMSE obtained for the profile is 2.528
| Title | The lithosphere-asthenosphere boundary observed with USArray receiver functions |
|---|---|
| Participants | Prakash Kumar |
| Sponsoring Agency |
Work Description:
The dense deployment of seismic stations (see Fig. 7.1) in the western half of the United States within the USArray project provided an opportunity to study the structure of the lithosphere-asthenosphere boundary in greater detail using the S receiver function technique. Only two major discontinuities, namely the crust-mantle boundary (Moho) and the lithosphere-asthenosphere boundary (LAB) are observed in the entire area down to about 300 km depth (example Fig. 7.2). The LAB is at a depth of 70–80 km over large parts of westernmost North America. East of the Rocky Mountains, its depth is generally between 90 and 110 km (Fig. 7.3). Regions with LAB depths down to about 140 km occur in a stretch from northern Texas, over the Colorado Plateau to the Columbia basalts. These observations agree well with tomography results of the westernmost USA and on the east coast. However, in the central cratonic part of the USA, the LAB inferred from tomography is near 200 km depth. At this depth, no discontinuity is seen in the S receiver functions.
The stretch of deep LAB structures from the border region of Texas and Oklahoma, over the Colorado Plateau to the Columbia basalts could perhaps be related to fragments of the Farallon slab. Shallow (near 100 km) depths of the (possible) LAB beneath most parts of North America have also been found by other workers (Rychert and Shearer,2009; Li et al. 2007, Rychert et al., 2007; Abt et al. 2010). In the central part of the USA, Abt et al. (2010) use the name Mid Lithospheric Discontinuity (MLD) for the negative discontinuity near 100 km depth, since the LAB is thought to be deeper. The MLD might be identical with the 8° discontinuity postulated by Thybo (1997) for the continental mantle globally. Disagreement between the S-RF LAB and the tomography LAB is not the only case where depth determinations of the LAB are inconsistent among different geophysical methods (see e.g. the discussion by Eaton et al., 2009). A good comparison of LAB depth determinations with magnetotelluric techniques, receiver function techniques and P travel time residual techniques in Europe is presented by Jones et al. (2010). The missing confirmation of the deep surface wave LAB (near 200 km) by S receiver functions is interpreted as being caused by a broad negative gradient at this depth, which is supposed to be unresolvable in S receiver functions (Romanowicz, 2009). Our results agree well with petrophysical models of increased water content in the asthenosphere, which predict a sharp and shallow LAB also in continents (Mierdel et al., 2007).
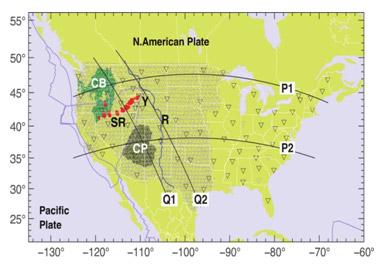 Fig.7.1:
Map of the United States with USArray sites (gray inverted triangles) and the permanent U.S. network (sparse black inverted triangles) through spring 2011. CP = Colorado plateau, CB = Columbia basalts, R = Rocky Mountains boundary, SR = Snake River plain (red blobs), Y = Yellowstone caldera. P1, P2, Q1, and Q2 are profiles along which the seismic S-receiver function images are analyzed.
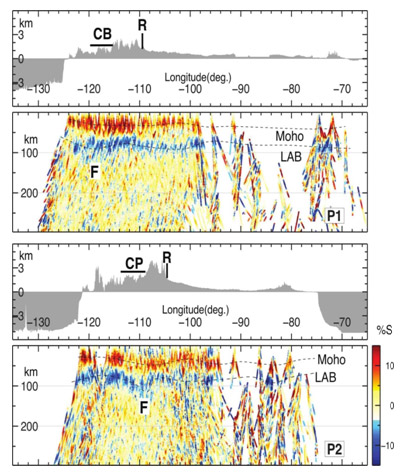 Fig.7.2:
Migrated S-receiver function images along the profiles P1 and P2 running roughly east-west through the United States (see Figure1 for location). Moho and LAB are marked. F marks regions of LAB deepening.
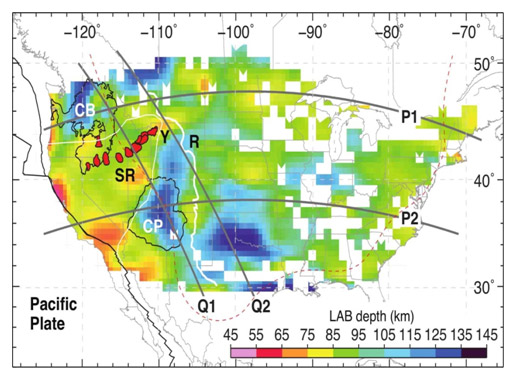
Fig.7.3:
Lithospheric thickness map obtained from USArray data using S-receiver function analysis. The red dashed line marks the extent of the stable cratonic region (Yuan and Romanowicz 2010).
| Title | Geological analysis of young impact craters on the Moon |
|---|---|
| Participants | P. Senthil Kumar, and U. Sruthi |
| Sponsoring Agency | PLANEX (ISRO) |
Work Description:
[1] Probing lunar interior by geological mapping of Antoniadi basin, Moon:
Antoniadi proto-basin (144 km diameter) excavated the floor of South Pole Aitken (SPA) basin, which is one of the largest impact structures in the Solar System and an internationally important target area for lunar science. One of the major goals is to understand the lunar interior that can be addressed by studying Antoniadi, which penetrated through SPA as deep as ~14 km. Using Lunar Reconnaissance Orbiter, wide and narrow angle camera images and laser-measured topography, we have carried out geological mapping of Antoniadi basin (Fig 8.1). The results are as follows: (a) Antoniadi is younger than Minneart and Numerov based on superposition relations; (b) Antoniadi is an oblique impact structure with projectile arriving from the southeast, as suggested by the secondary craters, crater wall slumping and absence of peak-ring in the down-range, (c) large sheets of impact melts found as ponds near the foot of interior wall; (d) hummocky floor between the wall and peak ring with subtle modifications; (e) presence of a dark, smooth mare units surrounding the central peak with a local linear subsidence; (f) formation of a Copernican age 10-km size simple crater that was emplaced in the peak-ring with its ejecta possibly containing some of the upper mantle materials. For determining the ages of mare units, we carried out crater counting in some areas that are unaffected by ejecta deposits from the surrounding younger impact events. Cumulative size frequency distribution of craters provides an age of ~1.83 Ga. On the other hand, the ejecta provides an age ~3.6 Ga (Upper Imbrian age), suggesting that magmatism affected this basin approximately after 1.5 billion years. These findings are significant considering the goals of the international lunar missions targeting the SPA for better understanding of the lunar interior. Antoniadi is possibly an exciting place to explore the lunar materials of deeper origin. When we carried out the geological mapping of Antoniadi, we have come across new occurrences of volcanic cones on the floor of the basin. One of the cones is shown in Fig 8.2. Some of the cones are prominently associated with the central mare unit, as these are the sources of the mare lava flows. Crater counting chronology of these lava flows provides an age of 1.73 Ga (late Eratosthenian), reflecting the latest volcanic episode of some of the cones.
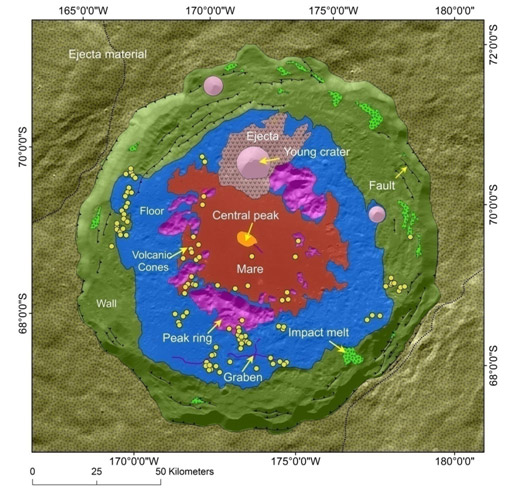
Fig.8.1:
Geological map of Antoniadi basin on farside of the Moon
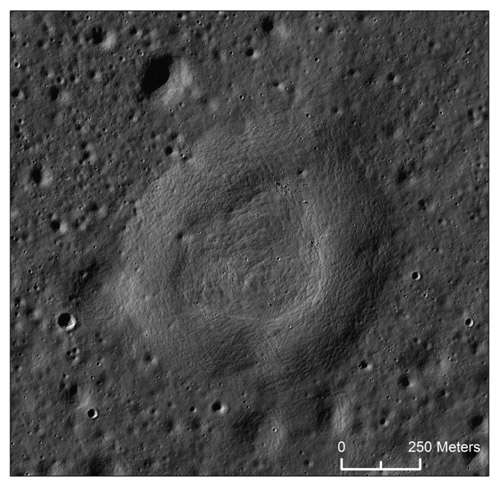
Fig.8.2:
LROC NAC image showing a volcanic cone in Antoniadi basin
| Title | Inductively Coupled Plasma Mass Spectrometry (ICP-MS) facility at NGRI |
|---|---|
| Participants | V.Balaram, NP.Rajendra Prasad, M.Satyanarayanan, Parijat Roy, KSV.Subramanyam, SS.Sawant, D.Purushottam |
| Sponsoring Agency | CSIR and DST |
Work Description:
Xenon as Internal Standard for the Accurate Determination of Trace Elements in Water Samples by ICP-MS
Inductively coupled plasma mass spectrometry (ICP-MS) has become one of the most powerful analytical tools for the precise determination of trace elemental concentrations in a variety of geological and environmental materials, including ground and surface waters. This work describes application of xenon (129Xe) as an internal standard for the precise and accurate determination of several trace elements in different kinds of water samples by inductively coupled plasma mass spectrometry (ICP-MS). The novelty of this approach is that no external addition of any reagent is involved since xenon is present as an impurity in the plasma gas itself. As a result, the possibility of introducing any type of elemental impurities through the addition of an internal standard will be completely avoided. Therefore, this feature will be of great value when determinations are carried out for elements present at ng/mL and sub-ng/mL levels. The utility of 129Xe as an internal standard has been validated using standard reference materials NIST 1640d, NIST 1643e, and NIST 1640a. The accuracies and precisions achieved were markedly better when internal standardization was applied. In general, trace element data in a variety of water samples were obtained with < 5% RSD with comparable accuracy in each case, suggesting that this method can be applied routinely for the determination of trace elements in water.
| Title | Magnetotelluric investigations in Sikkim |
|---|---|
| Participants | Prasanta K. Patro, K. Chinna Reddy, Narendra Babu and K. Shankaraiah |
| Sponsoring Agency | MoES |
Work Description:
Sikkim region falls between Main Boundary Thrust (MBT) and Main Central Thrust (MCT). In 1988, Sikkim witnessed magnitude of 6.6 earthquake. It is believed that the seismic activity is confined to the MBT and MCT in the Sikkim Himalaya. With an aim to understand the electrical signatures of the thrust zones such as Main Frontal Thrust, MBT and MCT, NGRI acquired 18 broad-band (0.001 to 1000s) magnetotelluric stations in 2005, (Patro and Harinarayana, 2009) from Siliguri (in the south) to Yumthang (in the north).
In 2006, Sikkim region is struck with another moderate earthquake of magnitude 5.3.In order to understand the conductivity changes associated with the earthquake, MT data was acquired at 20 MT (0.001 to 1000 s) and 6 LMT (100 to 12000 s) locations during Sep, 2011 to Dec, 2011 field season (Fig 10.1). At each station, broad band data was acquired for 3 days. LMT data was acquired for 8 to 11 days. Remote reference recording was carried during the data acquisition. One of the main objectives of the study was to re-occupy old stations using same kind of instruments for same frequency range. We could successfully reoccupy some of the old stations while we could not re-occupy a few stations due to growing civilization (see Fig 10.2) and/or damage/closure of roads due to 18th September 9 Mw earthquake.The preliminary data analysis results are presented in the fig 10.3 at a site ‘ran’. In this figure, for a comparison the MT transfer function computed during 2005 is also presented.
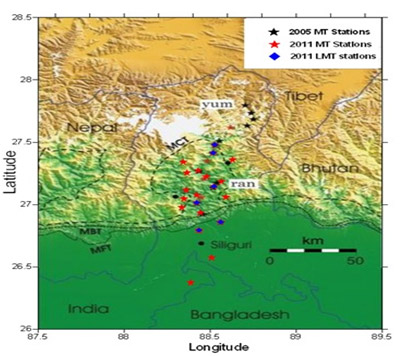
Fig.10.1:
Location map of MT and LMT stations in Sikkim Himalayan region, India.
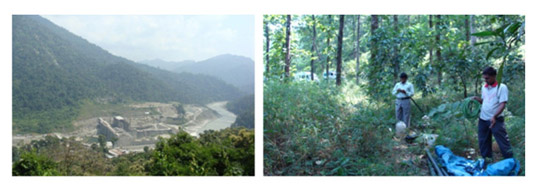
Fig.10.2:
Pictures to the left shows the old site now turned to a hydro power project. The picture to the right is a site in the road side jungle.
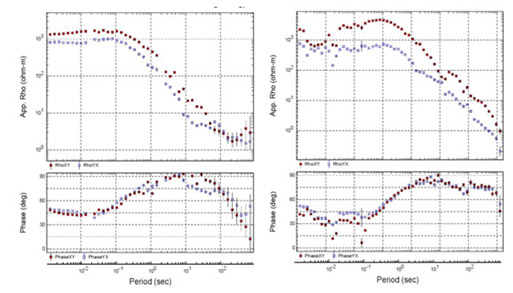
Fig.10.3:
Pictures to the left shows the old site now turned to a hydro power project. The picture to the right is a site in the road side jungle.
| Title | Delineation of the crustal structure of the Ganga Basin through magnetotelluric investigations |
|---|---|
| Participants | A. Manglik, S. Thiagarajan, M. Suresh, L. Adi Lakshmi, Ankur Kumar, T. Sriyutha |
| Sponsoring Agency | Ministry of Earth Sciences |
Work Description:
This project aims at delineating the basement configuration and the electrical resistivity structure of the underlying crust along Agra - Nainital (AN) and Mahoba - Bahraich (MB) profiles across the Ganga basin through magnetotelluric investigations. We have carried out MT field survey along the MB profile (Fig.11.1) and acquired data at 64 sites spanning the profile length of about 400 km in three different field sessions. The acquired MT time series have been analyzed to remove noisy data segments and then processed to estimate the apparent resistivity and phase curves using commercial software package Mapros (M/s Metronix GmbH). Preliminary analysis of the apparent resistivity and phase data has revealed remarkable variations in the thickness of sediments along the profile.
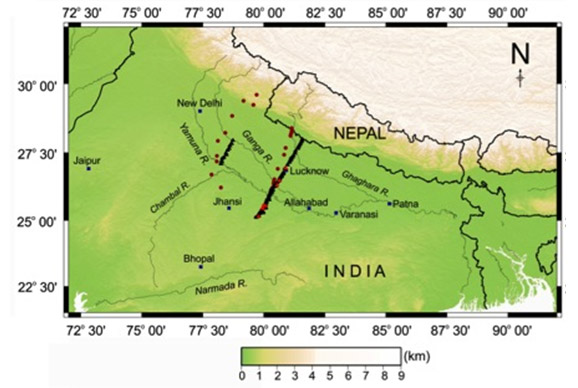
Fig.11.1:
MT sites covered along the MB profile (black triangles). Sites shown by red triangles have been discarded due to bad data quality. Locations of broadband seismological stations are also superimposed (maroon circles).
| Title | Fe isotope compositons of 13C enriched carbonates from the Paleoproterozoic Aravalli Supergroup, NW India |
|---|---|
| Participants | B. Sreenivas and Anil Kumar |
| Sponsoring Agency | CSIR-NGRI |
Work Description:
Fe isotope compositons of 13C enriched carbonates from the Paleoproterozoic Aravalli Supergroup, NW India
The Fe isotope compositions of biogenic sulfides document evidence for the ‘Great Oxidation Event’ (GOE) at ~ 2.32 Ga, defined by variable and negative δ56Fe values prior to 2.3 Ga and positive values during post-GOE period [Rouxel et al., 2005, Science 307, 1088-1091, (1)]. Subsequently, it has been shown that the Late Archean microbial carbonates also are characterized by negative and variable δ56Fe values between -2.06 and -0.47 ‰ IRMM-014, while the Phanerozoic and modern ones exhibit a narrow δ56Fe range of -1 to 0 ‰ [von Blanckenburg et al., 2008, Chem. Geol249, 113-128 (2)]. Here, we report Fe isotope compositions of ~ 2.0 Ga carbonate rocks and stromatolitic phosphorites from the Paleoproterozoic Aravalli Supergroup of North western India (Fig. 12.1) to decipher the effects of GOE in the Fe isotope record of microbial carbonates. The Aravalli carbonates of the Jhamarkotra Formation are characterized positive δ13C values up to 12 ‰ V-PDB while the phosphatic stromatolites show enrichment of 13C in organic carbon constituting the unique example from Indian rock record for global 13C excursions during the Paleoproterozoic. These samples show rare earth element and Yttrium patterns similar to seawater sources indicating that their Fe isotope compositions represent that of hydrogenous carbonates and hence reflecting the seawater Fe rather than those of primary or secondary Fe-Mn oxides. The samples show δ56Fe values from -0.34 to 0.93 ‰, similar to the Paleoproterozoic biogenic sulfides (Fig.12.2). Overall, the global Fe isotope data on microbial carbonates including the Aravalli examples define a secular trend similar to that of biogenic sulfides thereby indicating control of GOE on the marine Fe isotope geochemical cycle.
(B. Sreenivas, B. Vijaya Gopal, Y.J. Bhaskar Rao)
Precise 207Pb–206Pb baddeleyite geochronology by the thermal extraction thermal ionization mass spectrometry method.
The ability to easily obtain precise (~0.1%) age determinations on mafic rocks can open new avenues of research investigations related to mantle processes and paleocontinental redistribution. We present high precision Pb age determinations on baddeleyite (ZrO2), a common accessory mineral in mafic rocks using thermal extractionthermal ionization mass spectrometer (TE-TIMS) method. To constrain thermal extraction of Pb from baddeleyite, SEM back-scattered electron images along with energy-dispersive x-ray spectroscopy spot analysis were acquired at progressively increasing temperature between 1200 and 1590°C. Replicate analyses of twelve preheated (at 1250°C) silica embedded baddeleyite fractions from the Phalaborwa carbonatite standard using this procedure has yielded a 207Pb–206Pb weighted mean age of 2060.2±0.4 Ma (Fig 12.3), consistent with previously reported 207Pb–206Pb ages for this carbonatite standard at 2059.7 ± 0.35Ma determined by the conventional U-Pb isotope dilution-thermalionization mass spectrometry (ID-TIMS) technique. Our results demonstrate that thermal extraction 207Pb–206Pb ages are comparable with conventional U-Pb ages in both accuracy and precision. This procedure does not need ultraclean laboratory conditions (<1 pg procedure blanks), a prerequisite for conventional high precision U-Pb geochronology, and hence can be easily practiced in most TIMS isotope geochemistry laboratories.
(Anil Kumar, D. S. Sarma, E. Nagaraju, V. Parasharamulu)
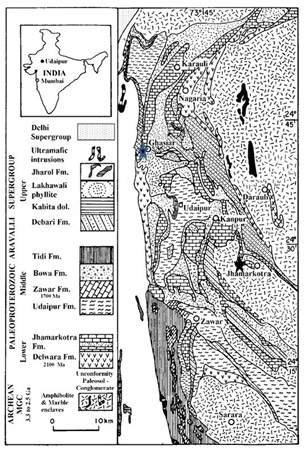
Fig.12.1:
Geological map of part of the Aravalli Supergroup.The 13C enriched carbonates from Ghasiar and Jhamarkotra are marked with a star.
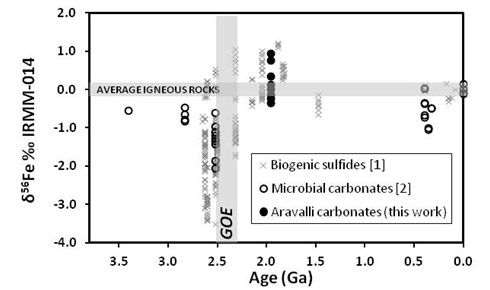
Fig.12.2:
Fe isotope compositions of biogenic sulphides [after 1], microbial carbonates [after2] and new data on Aravalli carbonates.The horizontal grey shaded region represents the Fe isotope compositions of igneous rocks and the vertical one denotes the timing of GOE
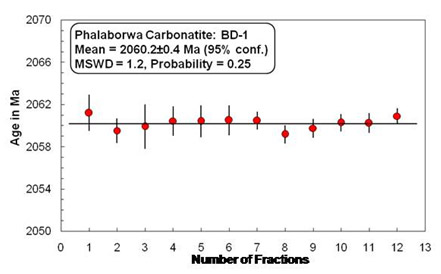
Fig.12.3:
TE-TIMS weighted mean 207Pb/206Pb ages on 12 baddeleyite fractions from the Phalaborwa carbonatite. Errors bars represent 95% confidence limits of measurements.
| Title | Seismic signatures of the crust beneath the Godavari rift. |
|---|---|
| Participants | Arun Singh, M. Ravi Kumar, Narendra Kumar, Dipankar Saikia, P. Solomon Raju, D. Srinagesh, N. Purnachandra Rao, Dipankar Sarkar |
| Sponsoring Agency | CSIR-NGRI, MOES |
Work Description:
The Godavari rift valley in the south Indian shield that sutures the Dharwar and Bastar cratons is a very less studied region in terms of its deep seismic structure. In the present study, a total of 1559 receiver functions from 777 earthquakes registered by a 10 station network are utilized to investigate crust and mantle structure (Fig.13.1). Broadly, the crustal architecture underneath the rift appears very complex with the presence of intracrustal layers and a weak Moho compared to a sharp Moho and a simple crust outside it (Fig.13.2). Detailed modelling of receiver functions at 6 stations using the Nearest Neighbourhood Algorithm approach reveals a 40 km thick crust within the rift compared to a 33 km thick crust in the adjacent Dharwar craton (Fig.13.3). Also, the lower crustal character is found to be distinctly different, with a faster lower crust beneath the rift. A weak Moho beneath the rift may be due to magmatic underplating. The transition zone (660–410 km) structure inferred from the common conversion point stacks of receiver functions can be interpreted in terms of the absence of (a) thermal anomalies within and above the mantle transition zone (MTZ) (b) thin lithosphere or high temperatures in the uppermost mantle. Magmatic underplating within the crust and a normal MTZ argue in favour of a rift formed due to lithospheric stretching without the influence of a mantle plume.
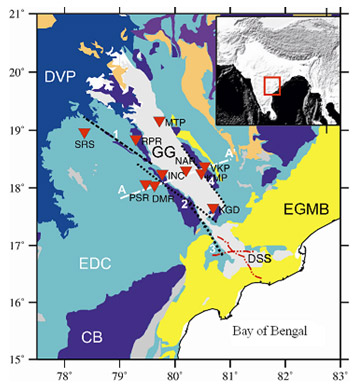
Fig.13.1:
Tectonic map of the Godavari region with the prominent faults and seismic stations (inverted triangles). The inset shows the study region in India. The deep seismic sounding profiles are indicated as red dotted lines. The while dashed line A–A represents the gravity profile (Mishra et al., 1987). DVP: Deccan Volcanic Province; EDC: Eastern Dharwar Craton; GR: Godavari rift; EGMB: Eastren Ghat Mobile Belt; 1, Kaddam Fault; 2, Kinnerasani-Godavari Fault; 3, Kolleru-Lake Fault; 4, Godavari Valley Fault
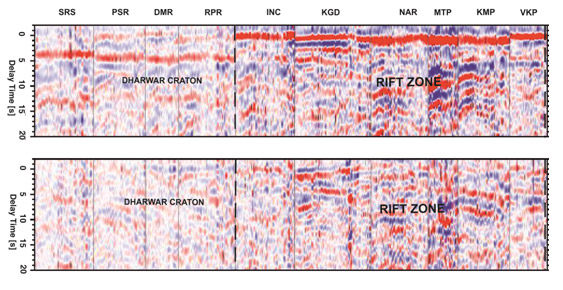
Fig.13.2:
Radial (top panel) and transverse (bottom panel) receiver functions at stations. The traces are first grouped in 72 backazimuthal bins and then sorted by slowness in each bin. Stations are sorted from south to north. Positive amplitudes are represented by red and negative ones by blue. A total of 1559 receiver functions are used to construct this image.
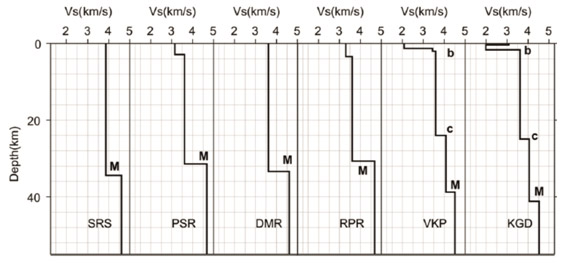
Fig.13.3:
Crustal models obtained through inversion. Prominent layers are marked by M, c and b. M: Moho; c: Crustal layer; b: Basement. The simple crust beneath stations DMR and SRS, does not necessitate intracrustal layers to be incorporated in modelling.
| Title | Lab measurement of Deccan basalt samples from Killari borehole |
|---|---|
| Participants | O.P. Pandey, Ravi P Srivastava, Nimisha Vedanti, S. Dutta and V.P. Dimri |
| Sponsoring Agency | CSIR-NGRI |
Work Description:
We analyzed 45 rock samples (29 basalt and 16 basement) from Killari borehole drilled to a depth of 617m (338m basalt column). This study reveals highly in-homogenous nature of basaltic eruptions as visible from Fig 14.1 and 14.2. Interestingly, basement samples have shown much higher velocity and density than basalt. Thus, we can expect a good impedance contrast between basalt and basement. Porous basalt samples tend to show higher attenuation than non porous samples. Surprisingly some basalt samples show very low attenuation and need detailed investigation.
In view of new attenuation results, seismic modeling algorithm will be modified once all the measurements are available.
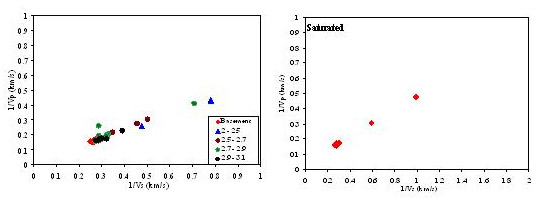
Fig.14.1:
Basement samples are shown in red and basalt samples are categorized under four different catagories based upon measured dry density
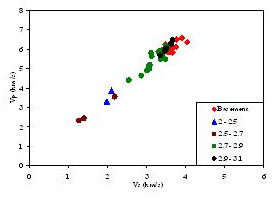
Fig.14.2:
Plot of Vpand Vs. Basement samples are shown in red and basalt samples are categorized under four different catagories based upon measured dry density.
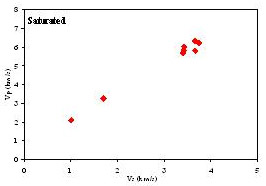
Fig.14.3:
Vp Vs plot for Saturated samples
| Title | Magnetotellurics & Deep Resistivity Soundings – Application to Resource exploration and studies of Crust/Lithosphere and improvement of techniques of data acquisition and interpretation |
|---|---|
| Participants | Prasanta K. Patro, K. Veeraswamy, Ashok Babu, B. Veeraiah, S. Prabhakar E.Rao, K.K. Abdul Azeez, K.Chinna Reddy, Narendra Babu, Arvind K. Gupta, D. Malleswari, V. Suresh, Ujjal. Kr. Borah, Kasi Raju, N. Rohit, D. Hanmanthu,B. Kishankumar, Amit Tiwari, K. Adikesavachari, Sivamallaiah Sana, Koteswara Rao, C. Balakrishna and K. Parameshwar |
| Sponsoring Agency | CSIR-NGRI |
Work Description:
Resistivity structure of the Central Indian Tectonic Zone (CITZ) from multiple magnetotelluric (MT) profiles.
(K. K. Abdul Azeez, Martyn Unsworth (University of Alberta, Canada), Prasanta K. Patro and T. Harinarayana)
This study presents the first systematic investigation of the resistivity structure of the CITZ using multiple magnetotelluric (MT) transects. Two-dimensional (2D) resistivity models were generated for 5 north-south profiles crossing the CITZ (Fig.15.1). The models were based on the joint inversion of transverse electric (TE), transverse magnetic (TM) and tipper (Hz) data. All the profiles showed a low resistive (10-80 Ωm) middle to lower crust beneath the CITZ (Fig. 15.1.) with a crustal conductance of 300 – 800 S. The presence of an interconnected fluid phase and/or hydrous/metallic minerals appears to be the most likely explanation for the elevated conductivity that is observed beneath the CITZ. The presence of fluids is significant because it may indicate the cause of persistent weakness at crustal depths. A northward dip of both the crustal conductive layer and coincident seismic reflections favor a northward polarity of the subduction process associated with the formation of the CITZ.
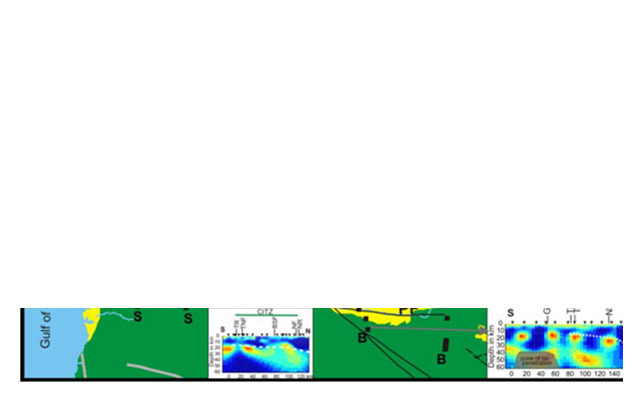
Fig.15.1:
Location of the MT profiles across the CTIZ and the respective 2D resistivity models obtained (enlarge this figure)
| Title | Development of Godavari Rift System: inferences on the insitu eruption of Rajahmundry Traps, K-G Basin [MLP 6201-28 (CM)] |
|---|---|
| Participants | Manikyamba, C, Lakshminarayana, G, Abhishek Saha, Sohini Ganguly |
| Sponsoring Agency | CSIR-NGRI |
Work Description:
Gondwana Rift System (GRS), India is unique with coal and hydrocarbon potential resulted due to multiple episodes of sedimentary basin development that are related to major evolutionary events in the context of the east Gondwanaland. It has thick sedimentary sequences of middle Proterozoic to Recent recording multiple episodes of sedimentary basin development. GRS consists of NW-SE trending intracontinental Godavari Rift (GR) and NE-SW oriented continental margin Krishna-Godavari Basin (K-G Basin). GR has Pakhal and Sullavai basins with middle-late Proterozoic sedimentary successions having quartzite-phyllite-dolomite in the former and sandstone-conglomerate assemblage in the later, developed at the contact zone of Archean Dharwar and Bhandara cratons. These are followed by late Palaeozoic to Cretaceous Gondwana assemblages of sandstone-shale-coal which support coal mining in the area. Pakhal – Sullavai – Gondwana basin transition is separated by Eastern Ghats reworking events (1.0 – 0.5 Ga). Detailed geological and geochemical studies indicate that the Gondwana deposition is accomplished by northwest flowing axial drainage in which the provenance extended beyond the present limit of southeast coast of India. Phase-wise upliftment of Eastern Ghats took place during Mesozoic due to Gondwanaland break-up that controlled the sedimentation, gradual reversal of paleodrainage and development of coastal basin (K-G Basin). The Godavari Rift to K-G Basin transition is culminated by fissure type volcanic eruptions at Cretaceous-Tertiary Boundary (KT Boundary) known as ‘Rajahmundry Traps’ comprising of three pulses of volcanic eruptions with interlude of carbonate/red bole deposition (Fig.16.1). The Cenozoic rift basins with thick sedimentary prisms evolved in off-shore areas became target for oil exploration.
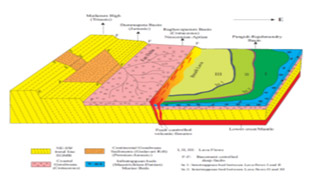
Fig.16.1:
A schematic model showing the intrabasinal eruption of Rajahmundry Trap Basalts (RTB) in Pangidi-Rajhamundry basin through fault-controlled fissures.
| Title | Geochemistry and Platinum Group Element systematics from Singhbhum craton |
|---|---|
| Participants | Manikyamba, C., Jyotisankar Ray, M. Satyanarayanan, Adrija Chatterjee, Abhishek Saha, Mutum Rajanikanta Singh, Sohini Ganguly, A. Keshav Krishna, K.S.V. Subramanyam, D. Purushotham, S. Sawant |
| Sponsoring Agency | DST |
Work Description:
The Older Metamorphic Group (OMG) of Singhbhum craton is the oldest Group (>3200 Ma) consisting of ortho and para amphibolites, pelitic schists, arenites, calc-silicates, mafic and ultramafic rocks. The ultramafic enclave has uniformly higher MgO and lower SiO2 (30.58 – 32.91 and 42-46.7 wt.% respectively) whereas the mafic rocks have 3.9-10.2 wt.% and 45.4-50.7 wt.% MgO and SiO2 respectively. The ferromagnesian trace elements also show consistent depletion from ultramafic to mafic composition. The Ni and Cr contents of the ultramafic rocks range from 492-1335 and 2404-4385 ppm whereas the mafic rocks show 191-291 and 667-1031 ppm indicating a much evolved chemical composition. The major and trace element composition has also reflected in their REE behavior. The ultramafic rocks have much depleted total REE (3.82-8.92 ppm) in comparison with the enriched mafic counterparts (14.5 – 29.01 ppm). The ultramafic rocks exhibit LREE depletion with variable degrees of HREE enrichment and exhibit negative Ce anomaly with positive to negative Eu anomaly (Fig. 17.1). The mafic rocks have flat REE patterns with positive to negative Ce and negligible Eu anomalies. Both mafic and ultramafic rocks have consistent troughs at Nb-Ta and Zr-Hf with low order negative Ti anomalies. Positive Ta anomalies are observed in few ultramafic rocks. The ultramafic rocks have higher platinum group elements (PGE) than their mafic counterparts (ΣPGE=9.2-41.8 and 9.9-27.4 ppm respectively). The major, trace and rare earth elemental compositions along with PGE systematics indicate that the ultramafics derived from higher degrees (30-45%) melting of a spinel peridotite source in the temperature regime of 1450-15000C where garnet entered into the melt; whereas the mafic rocks derived through fractional crystallization of the ultramafic melt
The IOG lavas from the Noamundi and Dangoaposi areas and dykes from Gajpur and Thakurani Pahad are porphyritic basalts with phenocrysts of plagioclase and clinopyroxene (major) and orthopyroxene (minor) embedded in a find grained cryptocrystalline groundmass. The lavas are tholeiitic (SiO2= 47.95-53.75 wt. % and Al2O3= 12.73-14.41 wt. %) with mafic to intermediate compositions (MgO= 6.35-15.54 wt. %) having a total alkali content varying from 1.1 -5.61 wt. %. They have variable concentrations of ferromagnesian trace elements (Ni=43-251 ppm; Cr=47-649 ppm), Zr (12-90 ppm) and total REE (28-145 ppm) and exhibit flat to slightly fractionated REE patterns with negative Eu anomalies (except one sample). Few samples have negative Nb, Zr and Hf anomalies whereas the others exhibit positive Ta anomalies. The Gajpur and Thakurani Pahad dykes intruded into IOG lavas are uniformly tholeiitic in composition with moderate MgO (7.4-13.3 wt. %) and total alkali (3.3-3.9wt.%) contents. These dykes have 41-112 ppm Ni, 28-244 ppm Cr, 34-781 ppm Zr and 61-144 ppm total rare earth element compositions. The dykes from both the areas exhibit slightly fractionated patterns with negative Eu. All the analysed dykes have negative Nb and positive Ta anomalies. Few of them exhibit positive anomalies at U, Zr and Hf whereas the others show distinct Zr-Hf troughs. The IOG lavas and dykes are extremely depleted in PGE and show a S-saturated character. The geochemical systematics indicates that the IOG lavas are products of variable degrees of partial melting and fractional crystallization of a depleted mantle source. PGE depletion in the analyzed samples supports the depleted mantle source for the origin of these rocks. The geochemical signatures of the dykes and the IOG lavas suggest their derivation in different melting events from a common depleted mantle source.
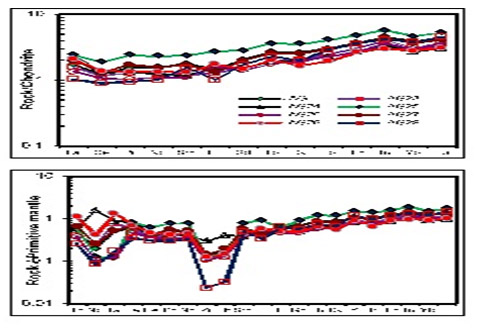 Fig.17.1:
Rare earth element and trace element Systematic of ultramafic enclaves from Older Metamorphic Group (OMG) of Singhbhum craton
| Title | DEEP GEO-ELECTRIC STRUCTURE OF THE DHARWAR CRATON (INDIA) INFERRED FROM MAGNETOTELLURIC STUDIES |
|---|---|
| Participants | K. Veeraswamy, K.K. Abdul Azeez, Prasanta K. Patro, A.K. Gupta, Narendra Babu, T. Harinarayana |
| Sponsoring Agency | CSIR-NGRI |
Work Description:
Broadband and long period magnetotelluric (MT) investigations along SW-NE oriented traverse from Chikmagalur (west) to Anantapur (east) of ~300 km have been conducted as a part of geological and geophysical imaging of Dharwar Craton. Bradband MT data has been acquired at 50 locations with a station interval of 6-8 km, and long period MT (50 - 15000 sec) data at 15 locations with spacing of 20-25 km(Fig 18.1.). Continuous MT time-series measurements over a period of about 3 days were made at each MT sounding location, while 10-12 days continuous recording were made for each LMT measurement site. Prior to modeling of the data set for meaningful conductivity structure along the profile, the MT data were analyzed to determine the dimensionality and appropriate geo-electric strike values. A value of -150 (N150W) estimated from multi-site, multi-frequency analysis is assumed as the regional geo-electric strike for the profile, which also corroborates with the surface geological trends in the area. The 2D electrical section shows (Fig 18.2.) high resistive (>10000 Ohm-m) top layer (up to 20 km) beneath the western part as compared to ~25 km thickness in the eastern Dharwar craton corroborating well with geological, deep seismic and other geophysical results. The top layer in the geoelectric section appears as a block structure, while at deeper levels (> 80 km) the electrical structure under WDC & EDC are significantly different. The model reveals a major deep vertical electrical discontinuity between WDC and EDC, which coincides with the eastern boundary of Chitradurga Schist belt on the surface. The model also shows that the base of lithosphere under WDC is relatively less resistive as compared to its counterpart under EDC. This probably suggests the alteration in resistivity characteristics due to the higher thermal effects imparted by the Reunion plume under WDC, which was located towards west of WDC during the 65-60 Ma period.
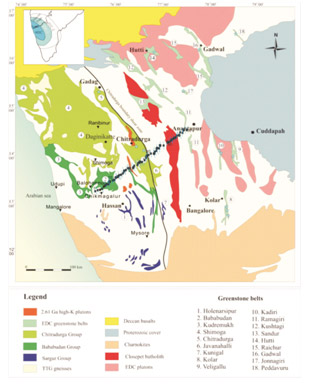
Fig.18.1:
The major geological features in Dharwar cratonic region. MT locations along with the best strike values estimated from the individual site using the method of Becken & Burkhardt (2004) are also shown.
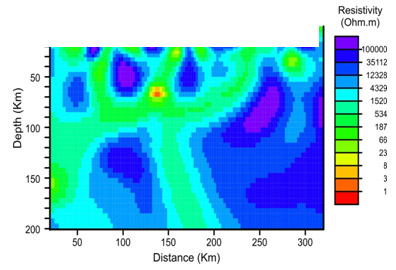
Fig.18.2:
Lithospheric scale resistivity model of the Chikmagalur-Anantapur profile, showing the main features resolved by the inversion process. Tectonic boundary between WDC and EDC has been reflected as a conducting interface.
| Title | Deep Resistivity Sounding studies across the Dharwar craton, Southern part of the Karnataka state, India |
|---|---|
| Participants | G. Ashok Babu , B. Veeraiah and B. Kishankumar |
Work Description:
The location and nature of the boundary between WDC and EDC are still debated inspite of an extensive geological and geophysical evidences. Most of the researchers have suggested one of two possible boundaries 1. Chitradurga thrust fault and 2. Closepet batholith. Differences of opinion exist over location of this fault, although there is general agreement over the importance of this feature in the evolution of the Dharwar craton. In order to understand the disposition of this boundary in the southern part of the craton, we have carried out Deep Resistivity Soundings (DRS) at 17 locations along 130 km long profile across the craton starting from Sanivarsante in the West to Huliyurdurga in East, Karnataka state, India(Fig 19.1). Pseudo-electrical resistivity image constructed with observed data for the qualitative interpretation and smooth model inversion was attempted for quantitative interpretation. The DRS results indicate that (Fig 19.1b)
- 1. High resistivity basement at shallow depth is observed along the entire profile except over schist belt.
- 2. Low resistivity variation in both lateral and vertical directions in the Schist belt area indicates the possible extension of weak zones present in the schist belt at depth.
- 3. Major Weak zone is observed in the west of Chennarayapatna (CR Patna) around Holenarsapura and east of Huliyardurga.
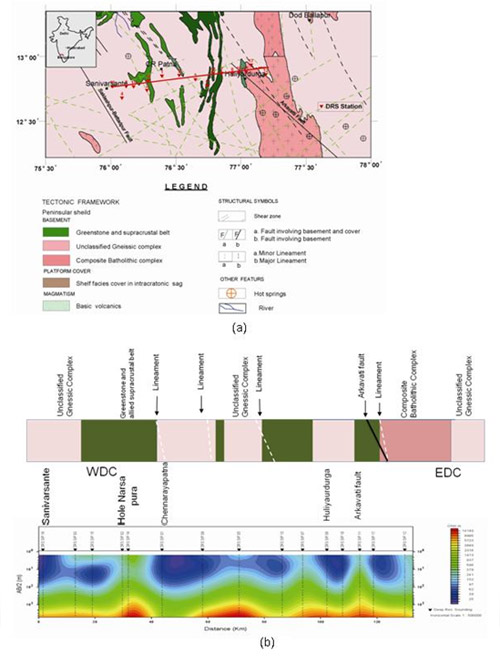
Fig.19.1:
(a) Location map of DRS stations along Sanivarsante-Huliardurga profile across Dharwar craton.
(b)Pseudo-electrical resistivity Section along Sanivarsante to Huliyurdurga
| Title | Neoarchean emplacement and metamorphism of Karimnagar granite and harnockite: zircon U-Pb age and Hf isotopic results |
|---|
Work Description:
The NW-SE trending Godavari Graben that separates the Archaean Dharwar and Bastar cratons of Peninsular India marks a zone of recurrent rifting. Along the southern shoulder of the graben (the northern limit of the Eastern Dharwar Craton), a belt of high-grade rocks (~ 150 x 30 km) - the Karimnagar granulites terrane (KGT), was described earlier (Rajesham, Bhaskar Rao and Murthy., 1993). The KGT comprises a fascinating lithological association of orthopyroxene-bearing quartofeldspathic gneiss, amphibolite-granulite facies supracrustal belts that include metamorphosed quartz- arenites, pelites, carbonates, iron formation and mafic rocks as well as several zones of migmatite and younger granitoid intrusives. Xenoliths within the charnockites show a wide-range of bulk compositions and multiple sapphirine-bearing mineral paragenesis. Previously, geochronologic studies of Karimnagar charnockites indicated a minimum age of metamorphism ca. 2500 Ma from convergence of i) Rb-Sr isochron ages (Rajesham et al., 1993; Sarbajna et al., 2012) and ii) EPMA CHIME ages showing zircon cores up to 3100 Ma mantled by rims of 2600 Ma, monazites and uraninites between 2420 and 2470 Ma (Santosh et al., 2004).
We determined zircon U-Pb ages and Hf-isotopic compositions (at the CSIR-NGRI LAM-MC-ICPMS National Facility) for two samples representing the widespread Karimnagar granite (older granite, KRN-90-30) and charnockite (KRN-90-24) (Fig. 20.1). Populations of zircons with < 10% discordance yield weighted mean 207Pb/206Pb ages of 2573±28 Ma and 2538±8 Ma (2s) respectively. These ages define crystallization of magmatic protoliths and regional high-grade metamorphism respectively. Both samples define lower intercept ages ~ 450 Ma. A similar range of eHf(T) between +1 to -10 and model TCDM Lu-Hf ages (~3.60 Ga) for both the suites indicate the involvement of Mesoarchean crustal components in the genesis of these Neoarchean magmas. The present data reinforce the Neoarchean (ca. 2.55 Ga) age for the KGT charnockite-granite suites, which is quite analogous to those in the transition zone and the SGT at the southern margin of the Dharwar craton, it would be fascinating to explore the age of their xenoliths.

Fig.20.1:
Geological sketch of the Karimnagar granulite terrain in the northeastern part of the Eastern Dharwar Craton
(Y.J. Bhaskar Rao, EVSSK Babu, T. Vijaya Kumar, B. Sreenivas, B. Vijaya Gopal, T. Rajesham)
| Title | First Finding of Native Gold from the Chromitites of the Mesoarchaean Tagadur Mines, Nuggihalli Schist Belt, Dharwar Craton, South India |
|---|---|
| Participants | Y.J. Bhaskar Rao, B. Vijaya Gopal, EVSSK Babu, B. Sreenivas, T. Vijaya Kumar |
| Sponsoring Agency | CSIR-NGRI |
Work Description:
First Finding of Native Gold from the Chromitites of the Mesoarchaean Tagadur Mines, Nuggihalli Schist Belt, Dharwar Craton, South India
Occurrence of native gold in ultramafic rocks is rather rare. Such occurrences serve as snapshots of the underlying processes leading to their formation and modifications thereafter. Presence of native gold as flakes were earlier reported from the chromites of rock massifs of Kraka, southern Urals, Russia. Gold spherules also occur as tiny inclusions (5-30 mm) in olivine, pyrrohotite and magnetite grains from the ultrabasic rocks of Loveld deposit, South Africa. For the first time, occurrence of native gold grains and flakes from the chromitites of the Mesoarchaean Tagadur Mines of the Nuggihalli Schist Belt (NSB), Dharwar Craton, south India are being reported. Geological Survey of India has already reported significant gold content from the bulk ultramafic rocks of Kempinakote area far south of the current study area. Broadly, the gold grains (Figure 21.1) occur in three distinct forms: (1) anhedral and dendritic flakes in the matrix (~1 to 480 mm); spherical and subspherical grains (~1 to 25 mm) and as inclusions in chromite grains (~ 5 to 35 mm). Petrographically distinct native gold grains also show some distinct compositional characteristics. The gold grains included in the chromite grains are nearly pure with a very minor component of copper. The spherical and subspherical grains in the ultramafic matrix have significant contents of Ag and Co. The anhedral and dendritic gold flakes in the matrix have significant Co content.
The petrographic character and the compositions indicate that the gold grains are syngenetic in nature and indicate the processes involved in the progressive crystallisation of the magma from which the minerals are crystallising. It further indicates that the gold in the native form is due to highly reducing conditions in the initial stages of crystallisation of the komatiitic melts from which the chromites are alleged to have formed.
(EVSSK Babu and DV Subba Rao)
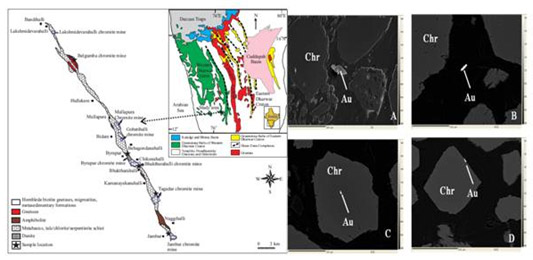
Fig.21.1:
Location map of the Nuggihalli Schist Belt, Karnataka and the BSE images of the Chromite grains with native gold inclusions.
| Title | Geological mapping at Kambum-Kamabamettu region,South India |
|---|---|
| Participants | D.V.Subba Rao, S.N.Charan and M.L.Renjith |
| Sponsoring Agency | CSIR-NGRI |
Work Description:
Detailed field work comprising of geological mapping at Kambum-Kamabamettu region, South India identified different types of carbonatite, and mica-pyroxenite and K-feldspar-rich granite and A-type granites. Field observations reveal that three litho units are emplaced as individual magma pulse at the present level of erosion. It is interesting note that there are three carbonatite varieties, include: i)very coarse grained calcite-rich carbonatite devoid of magnetite megacryst, ii) Megacrystic magnetite-rich carbonatite, iii) Reddish coloured, fine grained (Fe-rich?) carbonatite with calcite xenocrysts (both white and grey colour crystals). Field relationship show that fine grained Fe-rich carbonatite intrudes into the calcite/magnetite-rich carbonatite.
In addition, new occurrences of pyroxenite-syenite intrusive bodies were reported from Korangani area, NW of Theni, Tami Nadu for the first time. Petrological, multi-element geochemical and stable isotope studies on the above mentioned different lithologies are in progress.
(EVSSK Babu and DV Subba Rao)
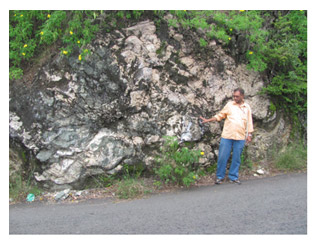
Fig.22.1:
Pyroxenite-felsic interleaved out crop after hair pin bend 5/18, Kambum to Khammumettu Ghat Road.
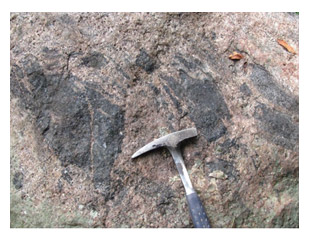
Fig.22.2:
Pyroxenite enclaves within the pink syenite found in the nala, Korangani, TN
| Title | DETAILED GEOCHEMICAL STUDIES ON GABBROIC ROCKS OF PASUPUGALLU PLUTON, PRAKASAM IGNEOUS PROVINCE, A.P, INDIA |
|---|---|
| Participants | V.BALARAM, K.S.V. SUBRAMANYAM, SAWANT S.S AND G.VIDYASAGAR |
| Sponsoring Agency | CSIR-NGRI |
Work Description:
The mafic magmatism predates the alkaline magmatism as evidenced by cross cuts of nephiline syenite dykes in Pasupugallu (PSG) and Ravipadu gabbro plutons. The PSG rocks have moderate MgO contents (5.0-11.8 %) and normal range of SiO2 (44.6-54.9 %), high Al2O3 (11.7-18.9%), medium to high CaO (10.2-13%), TiO2 (0.29-1.3%) and alkalies (1.39-3.3%) with trace amounts of P2O5 and MnO contents. The Mg number varies in the range of 72-53.
The PSG gabbros contain varying proportions of normative diopside (13-21%) and wide range variation in hypersthene (4.0-21.0%) which has been considered as a characteristic of tholeiitic rocks. The sample PSG-2 (olivine-norite) having 44.0% SiO2, 11.8% MgO (highest in the PSG series), 11.0% Al2O3, with very high iron content at 16.3% and 10% CaO. Further, Cr and Ni contents are recorded as 1136 (µg/g) and 340 (µg/g) respectively indicate the primitive nature of the sample. The gabbros of Pasupugallu pluton can be distinguished by high Al2O3 and TiO2 contents from other mafic plutons of the PIP. They are composed of plagioclase and clinopyroxene as essential mineral phases along with olivine, Opx, hornblende, biotite and opaques as accessory phases. Gabbros possess the modal compositions as plagioclase (80-60%), Cpx (40-20%), olivine (2-5%), biotite (2-5%), hornblende (2-5%) and opaques (1-5%). The presence of biotite in traces confirm the involvement of water during partial melting. Plagioclase mineral chemistry indicate compositional range An58.4-60.3 Ab38.8-40.6 Or0.8-0.9 classified as bytownite to labradorite which is a common plagioclase composition of island arc gabbros. Mineral chemistry studies of clinopyroxene indicate Quad (Quadrilateral Ca-Mg-Fe) composition relationships (Ca-rich). The average diopside composition recorded by gabbros of Pasupugallu series is Wo42.2 En 40.8 Fe 14.72. Based on Cpx mineral chemistry, the gabbros can be classified as island arc tholeiites. The Mg numbers of Cpx are in the range of 74.2 to 84.4 with an average of 80.2. The Cpx show normal SiO2 (46.0-49.0%), high Al2O3(4.9-6.1%), high TiO2 (1.2-1.78% ), high CaO (19-20% &Wo38.5-45.0), high MgO (12-14%), FeO (7-9%) whereas K2O, Na2O, MnO and Cr2O3 are in traces. Mineral compositions of the representative orthopyroxenes from coarse grained gabbronorites of PSG occupy clinoenstatite compositional field as Wo4.96-0.61En65.62-61.03Fs38.26-31.78 having very narrow range. The olivines are more Mg rich having average Fo66.3-Fa33.4 and compositionally described as crysolite to hyalosiderite on Fa-Fo discrimination diagram.
The primitive mantle normalised trace element abundances also support the above observations.
Chondrite normalised REE distribution patterns show enrichment of LREE and depletion of HREE with consistent high magnitude of Eu-positive anomalies, are indicative of cumulus plagioclase accumulation (Eu/Eu*=3.1-5.39) during fractional crystalisation. ∑REE range from 26.5-49.5 µg/g, whereas LREE range is observed to be between 23.7-43.0 µg/g for these rocks. HREE range (1.9-4.9 µg/g) show depletion characteristics relative to LREE abundances. Ti (µg/g)/1000 versus V (µg/g) binary plot discriminate the gabbros along the line dividing arc and OFB. The sub-alkaline tholeiitic magmatic character with enriched LREE, LILE, depletion in HREE and HFSE indicate lesser degree of partial melting within a subduction and island arc tectonic setting. The wide variation in ∑REE 26.5 to 49.5 µg/g is indicative of different degrees of partial melting. The PSG gabbros are the products of moderate (~10%) degree of partial melting of an enriched mantle source like garnet lherzolite. The melts are strongly modified by sediment and fluid additions during subduction further increasing the LILE component. They are the products of calc-alkaline to sub-alkaline (high-Al-Ti) tholeiitic mafic magmatism involved in early to middle stage fractional crystalisation of an alkali basaltic parentage.
∑PGE abundance shows a range from 46.5 to 72.6 ng/g. The primitive mantle normalised PGE distribution patterns show PPGE (Rh+Pt+Pd) and Cu relative enrichment over IPGE (Os+Ir+Ru) and Ni due to low degree of partial melting since the interstitial sulphides are preferentially incorporated into the liquid phase during low degree of partial melting results in high Pd/Ir ratios (Chen and Xia, 2008) and PPGE’s are incompatible as well during partial melting and crystal fractionation. The sulphur undersaturation demonstrated by Cu versus Pd plot further support above observations. The PPGEs are characterised by positive Rh and Pd anomalies coupled with relatively slightly depleted Pt negative anomalies. åPGE concentrations are ranging from 2 to 2.5 times when compared to the primitive mantle abundances 28.5 ng/g (Naldrett and Duke, 1980). Highly fractionated IPGE and PPGE patterns and PGE ratios indicate their derivation from a primitive MORB like crust undergone subduction zone processes. PGE abundance increase in the order Ir≤Os≤Ru≤Pt≤Pd≤Rh and higher ratios obtained such as Pt/Pt*, Pt/Ir, Pd/Ir and Pd/Pt w.r.t primitive mantle and chondrites may be due to the fluid induced matasomatism and addition of sediment to the melt derived from the down going slab.
The PIP is sandwiched between the high grade Eastern Ghat granulite mobile belt on the east and a stable craton (amphibolite facies) to the west along a sutured contact zone (Ratnakar and Leelanandam, 1989). Along this Proterozoic suture, the emplacement timing of syenitoid complexes during 1.3-1.1 Ga is well documented. The alkaline magmatism postdates the mafic plutonism in the region. These observations constrain the timing of mafic magmatism during 1.3-1.8 Ga in PIP (1.3 Ga & 1.8 Ga Kanigiri melange and Kandra ophiolites complex indicate the multiple collision events). Well-studied Chimakurti (clinopyroxinite, anorthosite and gabbro) pluton, show an intrusion age of 1352 Ma with its derivation from a high-Al tholeiitic parental magma with crustal contamination. Detailed geochronological studies are warranted on the mafic plutonic complexes to pin point the role and timing of mafic magmatism in evolution of PIP which will have implications on the co-spatial alkaline plutons of the region. The bulk rock geochemistry and mineral chemistry of PSG gabbros indicate low degree of partial melting of a primitive oceanic crust (MORB like) due to subduction and the melts emplaced as island arcs. Hence, we suggest the accretion of rootless mafic plutonic complexes as island arcs during multiple collision events occurred along the continental margin / Proterozoic suture during 1.3-1.8 Ga indicate the Mesoproterozoic continental growth along the south-eastern continent margin of India.
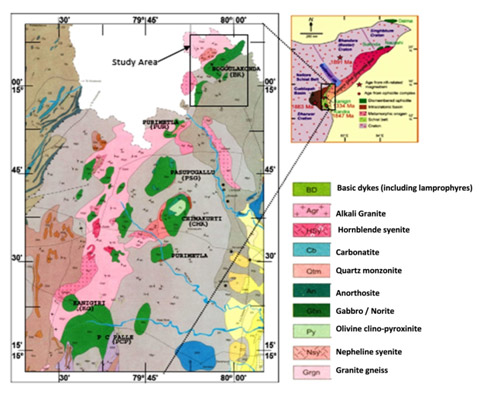
Fig.23.1:
Location and geological map of Prakasam Igenous Province showing various mafic pluton intrusions into the high grade rocks.
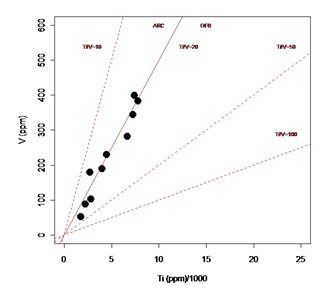
Fig.23.2:
Ti/1000 versus V - Tectonic discrimination diagram after Shervais (1982).
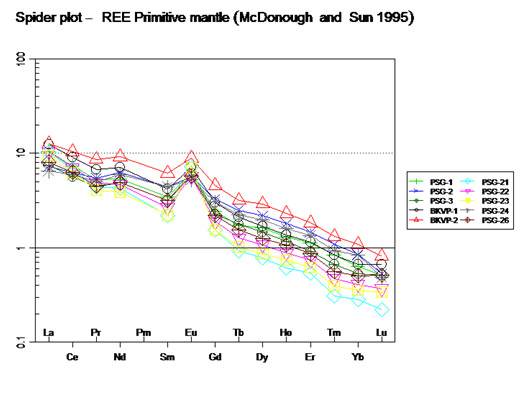
Fig.23.3:
Primitive mantle normalised rare earth element distribution patterns of Gabbroic rocks of Pasupugallu pluton
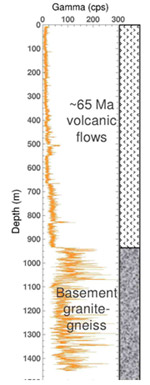
Fig.23.4:
Gamma log in borehole KBH-1 showing the sharp transition from basalt to granite-gneiss basement rocks at a depth of 933 m
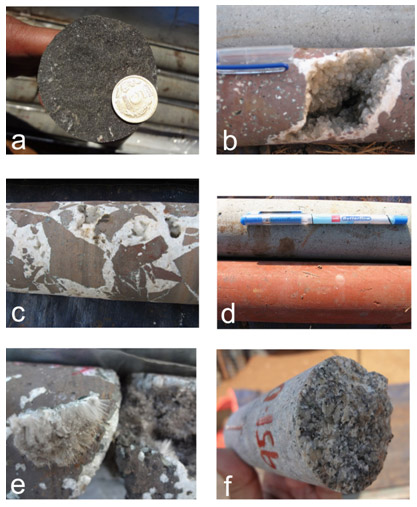
Fig.23.5:
Core samples from borehole KBH-1 showing (a) massive basalt, (b) vesicular and amygdaloidal basalt with large vugs filled with quartz and/or calcite, (c) flow-top breccia, (d) red bole bed and overlying massive basalt, (e) vugs filled with zeolite, and (f) basement granite at 951 m depth.
| Title | Plume-Arc interaction and evolution of the Holenarsipur Nucleus, Karnataka |
|---|---|
| Participants | M. Alam Siddiqui and M. Ram Mohan |
| Sponsoring Agency | DST under FASTTRACK scheme |
Work Description:
Detailed field and petrographic studies were carried out in the central part of Holenarsipur belt (HNB) of western Dharwar Craton. A massive anorthosite body is identified at the top of a sequence, where the serpentinised peridotite and meta-pyroxenite are exposed at the bottom and middle of the sequence. The weathering and alteration is conspicuous at outcrop scale, and is evident on thin section scale. The ultramafic rock association is traversed by mm to cm scale veins propagated in the network form. This unit exhibits two sets of joints perpendicular to each other and the whole rock is fractured, along these fractures, fluid circulation occurred leading to serpentinization (Fig.24.1A). Another variant of ultramafic rock that is layered; rich in magnetite, wherein the thin veins of secondary magnetite crosscut the whole lithology (Fig.24.1B). Further north, another variant of ultramafic rock is exposed showing hobnail type weathering pattern typical to that of the dunite (Fig.24.1C). Adjacent to this unit green coloured rock is found which is composed of chlorite (Fig.24.1E). On the extreme northern part, these ultramafics are traversed by later magnesite veins. Magnesite occurs as veins, colourless to white in colour with perfect two sets of cleavage (Fig.24.1D). In general, magnesia-rich olivine (forsterite) composition favours production of magnetite from peridotite while the iron-rich olivine (fayalite) favours the production of magnesite-magnetite-silica composition. To further north, a massive anorthosite/ anorthositic gabbro body is identified for the first time. This is the coarse grained, light grey coloured unit exhibiting typical hollow type weathering pattern, similar to the major anorthosite unit that occurs in the southern part of HNB (Fig.24.1F).
The basal unit is composed of olivine pseudomorph showing adcumulate texture although the unit is completely serpentinized (Fig.24.2A). The rock is composed of serpentine (lizardite+antigorite), talc, and magnetite (Fig.24.2B). The mesh texture is evident in the olivine domain and the rock is dunite (Fig.24.2C). Long prismatic orthopyroxene found in association with olivine pseudomorph as a cumulus phase and showing bastite texture (serpentine after pyroxene) (Fig.24.2D). The pyroxinite unit is completely altered and is composed of chlorite (clinochlore), amphibole and relict clinopyroxene (Fig.24.2E). Anorthosite is composed of coarse grained, undeformed plagioclase and amphibole showing orthocumulate texture (Fig.24.2F).
The field relationships and petrographic characteristics suggest that at least this part of the Holenarsipur belt is an intrusive complex which had undergone in situ differentiation, thus manifest magma chamber processes.
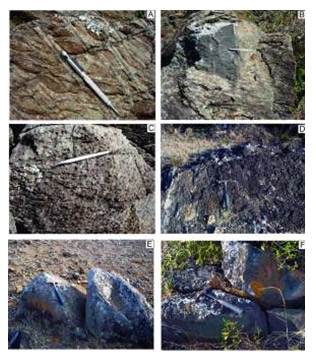
Fig.24.1:
Field photographs from the central part of Holenarsipur belt
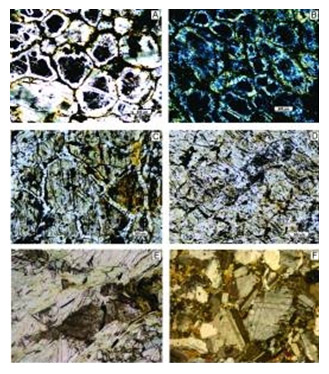
Fig.24.2:
Microphotographs of various lithounits in the central part of Holenarsipur belt
| Title | Geochemical studies of clastic sediments from Neoarchaean Bababudan Group, western |
|---|---|
| Dharwar craton | Implications for redox conditions, provenance modeling and tectonic setting |
| Participants | D.V.Subba Rao and B.Sreenivas |
| Sponsoring Agency | DST- New Delhi (Govt. of India) |
Work Description:
The Dharwar Supergroup comprises of the ~2.7 Ga old, lower Bababudan Group and the ~2.6 Ga old upper Chitradurga Group. The Late-Archaean Bababudan Group contain coarse and fine clastic sediments and were investigated with particular relevance to Precambrian redox conditions, provenance and tectonic setting of their deposition. A quartz pebble conglomerate (QPC) unit overlying the basement gneisses at the base of the Bababudan Group has detrital uraninite and pyrite indicating reducing conditions during their deposition at ~ 2.9 to 2.7 Ga. The QPC is followed by fluvial quartzites interbedded with metabasaltic lava flows forming the basal unit. These interlayered fluvial quartzites show very low Fe2O3/FeO (0.08 to 0.48) indicating low atmospheric oxygen concentration during the weathering of the provenance for these sediments. The QPC and quartzites are characterized by strong negative Eu anomalies, high HFSE/HREE. Abundance of Al2O3, alkalies, MgO, Cr, Ni, Co, Zr, V, Sc, Rb, Sr, ΣREE and their fractionated REE pattern suggest that restites derived from a dominantly granitic provenance with a minor mafic component and deposited on a stable cratonic platform. The increasing trend of Th/Sc and Zr/Sc ratios in these quatrzites supports continuous igneous differentiation of the source rocks.
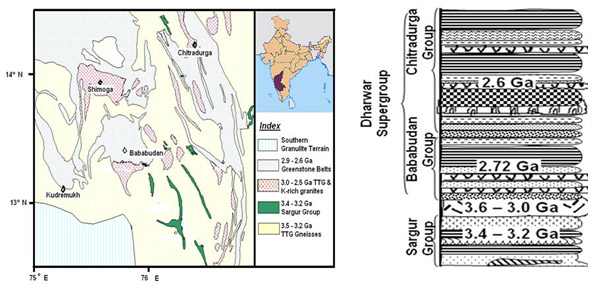
Fig.25.1:
Generalised stratigraphy of the Dharwar Supergroup and stratigraphic succession of Sargur and Dharwar Supergroup
The overlying sequence of shales/phyllites having higher concentration of Al2O3, Fe2O3T, alkalies, Zr, Th, U, V, Cr, La, Ce & Y indicating intense chemical weathering of the provenance. They also exhibit fractionated REE patterns similar to AAS, PAAS and UCC reflecting the felsic nature of the source rocks. The Bababudan metapelites of a mafic affinity (chlorite phyllites/quartzites) occurring in the upper stratigraphic horizon as seen in the Devarahalli-Lingadahalli section, have higher MgO (5.0 to 16.5%), Fe2O3 T (9.7 to 18.0%) and Al2O3/TiO2 ratios (13 to 24) when compared to the lower siliciclastic sediments of the Bababudan belt. Thus the metasediments of the Bababudan Group reveal signatures of strongly reducing and intense chemical weathering conditions during their deposition. These sediments were derived probably from a heterogeneous upper crustal source during the Neoarchaean period.
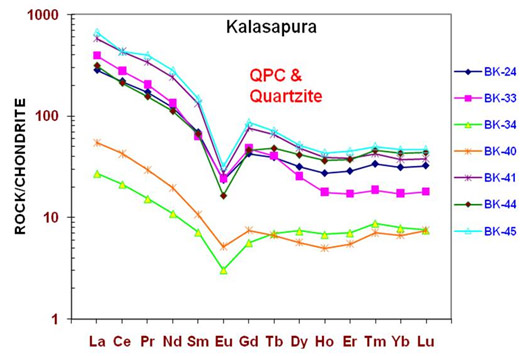
Fig.25.2:
Chondrite normalised REE distribution patterns of QPC and quartz arenites of Bababudan Group
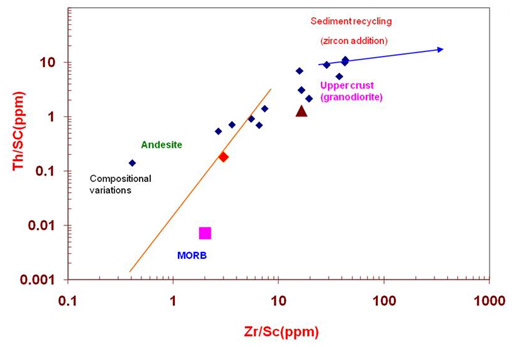
Fig.25.3:
Th/Sc versus Zr/Sc binary plot of Bababudan Group clastic metasediments
| Title | The first documentation of events of juvenile crust formation and crustal recycling in the Neoproterozoic high-grade terranes, the southern granulite terrain, S. India: new zircon U-Pb ages and Hf-isotopic systematics |
|---|---|
| Participants | Y.J. Bhaskar Rao, B. Vijaya Gopal, EVSSK Babu, B. Sreenivas, T. Vijaya Kumar |
| Sponsoring Agency | CSIR-NGRI |
Work Description:
The first documentation of events of juvenile crust formation and crustal recycling in the Neoproterozoic high-grade terranes, the southern granulite terrain, S. India: new zircon U-Pb ages and Hf-isotopic systematics
Understanding formation and evolution of any crustal block requires information on the chronology of major granitoid suites as well as the nature of their magmatic protoliths, especially with regard to the events of juvenile magmas vs. recycled pre-existing curst. The Madurai, Trivandrum and Nagercoil terranes of Southern Granulite Terrain (SGT, Fig.26.1) record pervasive Neoproterozoic high-grade metamorphism and a geochronological study of these terranes is crucial to unravelling evolution of the Gondwana Supercontinent. Orthopyroxene bearing granitic orthogneisses (charnockite) represent a volumetrically significant lithounit of the region. In recent years, whole rock Sm-Nd depleted mantle model age data for the Neoproterozoic charnockite orthogneisses attest to the involvement of ancient (upto 3.2 Ga old) crustal components in their magmatic (pre-metamorphic) evolution. This prompted considerable curiosity on the age, proportion and distribution of juvenile charnockites in the SGT. Our new zircon U-Pb ages and Hf-isotopic compositions (samples analysed at CSIR-NGRI and Adelaide University, Australia) using LA-ICPMS and LA-MC-ICPMS for 10 charnockite samples from the Madurai, Trivandrum and Nagercoil blocks are summarised as follows:
- In the northern Madurai block (NMB), north of the Karur-Kumbum-Painavu-Trichur Shear Zone (KKPTSZ, Fig. 28.1) a charnockite gneiss sample yields an U-Pb upper intercept age of 2451±7 Ma (all 1s errors) with Hf isotopic signatures suggesting involvement of upto 3.1 Ga older crustal components.
- Unlike in the NMB, charnockites from the Trivandrum and Nagercoil blocks show evidence for widespread juvenile Paleoproterozoic granite magmatism [1.88 to 2.04 Ga protolith ages with +3 to -5.6 eHf(t)].
- From the southeastern part of the Madurai block, we report evidence for juvenile magmas of Tonian age [~1.0 Ga protolith age and +2 to +10 eHf(t)]
- A large part of the Madurai block (south and east of the KKPTSZ) comprises Ediacaran charnockite protoliths (0.77-0.86 Ga) that are products of a variable degree of crustal recycling involving Neoarchean crustal components.
- Regional high-grade metamorphism in the Madurai, Trivandrum and Nagercoil blocks can be constrained at ~504 Ma, within the Ediacaran-Cambrian interval associated with amalgamation of Gondwana.
Consistent with our previous Sm-Nd depleted mantle model age data and geochemical data for charnockite orthogneisses from the SGT, our new zircon U-Pb age and Hf-isotopic data document the chronology of the juvenile crust formation events and magmatism through recycling of older crust, greatly enriching our understanding of the evolution of the SGT.
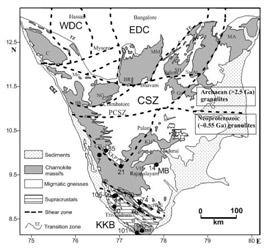
Fig.26.1:
Simplified geological sketch of SGT, S. India showing the location of charnockite gneiss samples studied. The figure also highlights major charnockite massifs and shear zone systems (see text).
(T. Vijaya Kumar, Y.J. Bhaskar Rao, Diana Plavsa, Alan Collins, J.K. Tomson, B. Vijaya Gopal)
The overlying sequence of shales/phyllites having higher concentration of Al2O3, Fe2O3T, alkalies, Zr, Th, U, V, Cr, La, Ce & Y indicating intense chemical weathering of the provenance. They also exhibit fractionated REE patterns similar to AAS, PAAS and UCC reflecting the felsic nature of the source rocks. The Bababudan metapelites of a mafic affinity (chlorite phyllites/quartzites) occurring in the upper stratigraphic horizon as seen in the Devarahalli-Lingadahalli section, have higher MgO (5.0 to 16.5%), Fe2O3 T (9.7 to 18.0%) and Al2O3/TiO2 ratios (13 to 24) when compared to the lower siliciclastic sediments of the Bababudan belt. Thus the metasediments of the Bababudan Group reveal signatures of strongly reducing and intense chemical weathering conditions during their deposition. These sediments were derived probably from a heterogeneous upper crustal source during the Neoarchaean period.
(T. Vijaya Kumar, Y.J. Bhaskar Rao, Diana Plavsa, Alan Collins, J.K. Tomson, B. Vijaya Gopal)
| Title | Mineral Chemistry of isotropic gabbros from the Manamedu Ophiolite Complex, Cauvery Suture Zone, Southern India |
|---|---|
| Participants | A. Keshav Krishna, K. Rama Mohan, M. Venkateshwarlu and T. Yellappa |
| Sponsoring Agency | CSIR-NGRI |
Work Description:
Mineral Chemistry of isotropic gabbros from the Manamedu Ophiolite Complex, Cauvery Suture Zone, Southern India
The Neoproterozoic Manamedu Ophiolite Complex (MOC) is one of the dismembered ophiolitic complexes with allochthonous units of a recognizable pseudostratigraphy in the eastern part of the Cauvery Suture Zone, Southern Granulite Terrain India. The complex comprises a well preserved ophiolitic sequence of ultramafic cumulates of altered dunites-pyroxenites, mafic cumulates of gabbros, gabbro-norites and anorthosites in association with plagiogranites, isotropic gabbros, metadolerites, metabasalts/amphibolites and thin layers of ferruginous chert bands. The isotropic gabbros occur as small intrusives and are associated with gabbro-norites and anorthosites. These gabbros are coarse to medium grained with non cumulate textures and show euhedral to subhedral orthopyroxenes, clinopyroxenes and subhedral plagioclase feldspars and rare amphiboles. Major and minor element compositions (Si, Ti, Al, Fe, Mn, Mg, Ca, Na, K, P, Cr, and Ni) of clinopyroxenes, orthopyroxenes, amphiboles and plagioclases were determined from a few selected rock samples of these isotropic gabbros. The analysis was carried on polished thin sections using an electron microprobe analyzer (Model: JEOL JXA8621) at the University of Tsukuba, Japan. The analyses were performed under conditions of 20kV accelerating voltage and 10mA sample current, and the data were regressed using oxide-ZAF correction method. The analytical mineral chemistry results reveals that the clinopyroxens of these gabbros show diopsidic to augitic compositions within the compositional ranges of En42-59, Fs5-12, Wo31-50 and are Ca-rich and Na poor (Na2O< 0.77wt %). These are also characterized by high-Mg (Mg# 68-82) and low-Ti (< 0.35 wt %). The tectonic discrimination plots of clinopyroxene data, Na vs Ti; Al vs Ti and SiO2/100-TiO2-Na2O plots show an island arc signature which is a new evidence for a supra-subduction zone magma genesis of Manamedu ophiolitic gabbros within the Cauvery Suture Zone.
(T. Yellappa)
| Title | Magnetostratigraphic, Biostratigraphic and Paleomagnetic investigations of Cauvery Basin sediments to constrain the drift history of the Indian subcontinent during Late Cretaceous period |
|---|---|
| Participants | R. Nagendra* and M. Venkateshwarlu *Anna University (Principal Investigator) |
| Sponsoring Agency | DST (No.SR/S4/ES-271/2007 dated 26-5-2008) |
Work Description:
This studyis focused to re-look the onshore sediments in terms of Magnetostratigraphy and biostratigraphy to understand the paleogeography of Cauvery Basin during upper Cretaceous. This detailed paleontological and Palaeomagnetic study of these upper Cretaceous formations would result in scientific data with respect to the migration of the subcontinent with well constrained paleontological and paleomagnetic records. These integrated studies will complement and supplement each other.
Therefore, it was decided to take up a detailed study of the Cauvery Basin sediments to understand the drift history of the subcontinent with well constrained fossil evidence.
Objective
- 1.To re-look the biostratigraphy records of outcrop sediments of late Cretaceous formations of Cauvery Basin and to constrain the drift history by integration of fossils geology to the paleoclimate, depositional environment, chronology and paleobathymetry.
- 2. Construction of Magnetostratigraphy column of outcrop lithosections of late Cretaceous sediments and its correlation with standard GTS-2008 and global late Cretaceous sedimentary sections.
- 3. To measureNatural Remnant Magnetic (NRM) properties of late Cretaceous sediments of onshore sediments. Identify and isolate the Characteristic Remanent Magnetic (ChRM) directions in Cretaceous sediment samples by demagnetization studies using AF, Thermal methods and Interpretation of the isolated ChRM components in terms of drift history of the Indian subcontinent during the late Cretaceous.
The upper Cretaceous sediments exposed near Tiruchirapalli and Vridhachalam in the state of TamilNadu and in the union territory of Pondicherry have been extensively studied for biostratigraphy and mega faunal remains. The foraminiferal study of the complete succession of cauvery basin has enabled to infer their palaeoenviroment and to relate them to the sea level changes.
The Paleomagnetic results of different sedimentary lithosections of late Cretaceous formations and the overall mean is tabulated (Table-1). It is inferred that the Indian subcontinent during late cretaceous was placed just above the Deccan Traps at 19.3°S.
Fig 28.2 is the composite section of Cenomanian to Maastrichtianlithosections studied at 564 m thick sedimentary sections belonging to Kari, Garudamangalam, Sillakkudi, Kallankurichchi and Ottakkovil Formations of Uttatur, Trichinopoly and Ariyalur Groups of Cretaceous sequences of Cauvery Basin. The observed Magnetic Polarity Stratigraphy of these sequences is computed with 13 magnetozones, 6 normal and six reversal events. The observed Magnetic Polarity Stratigraphy is correlated with GTS-2008. The late Cretaceous sequences consists of Karai Formation which is developed during late Cenomanian to Turonian age (99.6-93.6Ma), Garudamangalam Formation is divided in to two members. The Kulakkalnattam sandstone formed during Coniacian to early Santonian age (88.6 – 85.8 Ma) and Alandipur limestone is of middle to late Santonian age (85.8 – 83.5). Sillakkudi Formation is developed during Campanian age (83.5– 70.6), Kallankurichchi Formation has developed during early-middle Maastrichtian (70.6-66.5) and the terminal Cretaceous are exposed in Ottakkovil sandstone of late Maastrichtian age (66.5–65.5 Ma). These chronology are based on biostratigraphy frame work (Govidan,1996, Raju, et.al, 1996, Chidambaram, 2000, Nagendra et.al 2011).
Up to Santonian, a long normal magnetic polarity is present in the Cauvery Basin (Fig. 28.2) which is very well correlated with the standard Geological Time Scale and this falls under the Chron C34n which is the longest Normal quite polarity zone in the entire Cretaceous period. Above this, in the Campanian, one reversal and one normal event is recorded in the Cauvery Basin and is- correlates very well with standard GTS of chron C33n. In Magneto Chron C32n, one normal and two reverse polarities were obtained in Cauvery Basin sequences and correlate well with GTS whereas one normal and one reverse polarity is missing in this magnetozone as compared to standard GTS. This is because lack of sampling in portion of the strata or missing in Kallankurichchi Formation. Above this, in the magnetozone C31n one normal and one reverse polarity is observed and correlated well with GTS. At the end, the magnetozone C30n where one reversal and one normal polarity is obtained and it correlated very well with the standard GTS. The magnetic polarity stratigraphy of the late Cretaceous successions in the Cauvery Basin is correlated successfully with the standard GTS from Magneto chrons C34n to C30n.
Conclusions
The project is organized with objectives (1) to re-look the biostratigraphy records of outcrop sediments of late Cretaceous formations of Cauvery Basin and to constrain the drift history by integration of fossils geology to the depositional environment, chronology and paleobathymetry (2) Construction of magnetostratigraphy column of outcrop lithosections of late Cretaceous sediments and its correlation with standard GTS-2008 and global late Cretaceous sedimentary sections. (3) To measurement of NRM properties of late Cretaceous sediments of onshore sediments and (4) Identify and isolate the ChRM directions in Cretaceous sediment samples by demagnetization studies using AF, Thermal methods and Interpretation of the isolated ChRM components in terms of drift history of the Indian subcontinent during the late Cretaceous.
The study conducted in the Cenomanian-Maastrichtian sedimentary sections exposed in Cretaceous outcrop areas. The Paleomagnetism study qualified lithosections are identified in Karai, Garudamangalam, Kallankurichchi and Ottakkovil Formations of Uttatur, Trichinopoly and Ariyalur Groups. The studied outcrop site of Pondicherry and Vridhachalam areas samples are not yielded the paleomagnetic measurements records. However the biostratigraphy data were used in the comprehensive inferences. The identified lithosections were sampled for paleomagnetic and biostratigraphy studies. The oriented sample blocks were collected with attention to the suitability for Paleomagnetic measurements. The total of 193 blocks was cataloged for the studies. The limitations in sampling were notified, as the non-suitability and lack of outcrop lithosections. The macro and microfossil records were documented, in addition to the references of biostratigraphy framework of researcher’s published records. The magnetic measurements and its inferences were correlated with confidence of fossil records as it provides the physical evidences in terms to the prevailed geological conditions and its characteristics expresses to the dynamic conditions of the Cretaceous environment. The work outlined to bring out the drift history of the Indian subcontinent during upper Cretaceous as there is a data gap exists in the Latitudinal drift history of the Indian subcontinent during this period. This study has brought out very good magnetostratigraphy of the different litho sections in Cauvery Basin (Cenomanian-Maastrichtian) and was correlated very well with the standard GTS-2008 from Chron C34n to C30n and every magnetozone was matched very well. This correlation also supportive with the global upper Cretaceous sections from Russia, Europe and other upper Cretaceous sequences worldwide. The gap in the Latitudinal drift history of the Indian subcontinent has been filled with the Palaeolatitudinal position obtained from this study and placed Indian subcontinent at 20°S during entire upper Cretaceous period (65-100 Ma).
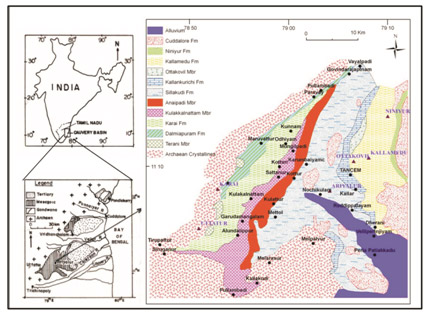
Fig.28.1:
Geological map of the study area
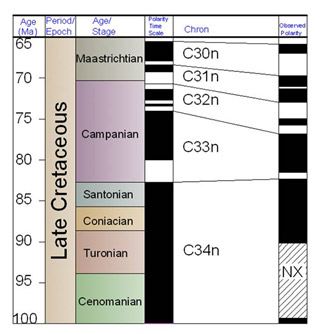
Fig.28.2:
Correlation of Magnetic Polarity Stratigraphy of Late Cretaccous with the standard geological Time Scale of Gradstein et al., 2004 and ogg et al., 2008
| Table 1. Paleomagnetic results of the late Cretaceous sequences, Canvery Basin | |||||||||
|---|---|---|---|---|---|---|---|---|---|
| Section | n | Dm | Im | a95 | ΛP | LP | dp | dm | Λm |
| O | 5 | 165 | -20 | 23.29 | -75.24 | 167.43 | 12.78 | 24.4 | -10.2 |
| K | 23 | 334 | -52 | 13.14 | 40.24 | 287.73 | 12.17 | 17.88 | -32.6 |
| S | 5 | 323 | -32 | 50.43 | 43.75 | 311.74 | 31.87 | 56.7 | -17.4 |
| A | 4 | 345 | -39 | 35.21 | 24.58 | 311.83 | 53.02 | 82.89 | -22.0 |
| KN | 3 | 344 | -27 | 41.05 | 60.32 | 291.46 | 24.16 | 44.54 | -14.3 |
| KA | 4 | 240 | -47 | 30.82 | -31.7 | 355.59 | 25.81 | 39.89 | -28.2 |
| Mean | 5 | 334 | -35 | 28.16 | 47 | 305/56W | 16.7 | 30.60 | -19.3 |
| O-Ottakovil, K-Kallankmuchi, S-Sillakndi, KN-Knlkamhattam, KA-Karai, Dm-mean Declimation, Im-mean inclimation, a95-Circle of confidence at 95% probability level, n-number of samples, Λp VGP Latitude, Lp-VGP Latitude, dp-ellipse of error, dm-perpendicular to ellipse and Λp-palaeolatitude. | |||||||||
| Title | Seismicity and site character of the Andaman-Nicobar Islands |
|---|---|
| Participants | G. Srijayanthi, M. Ravi Kumar, T. Sirisha, K. Sushini, G. Srihari Prasad, P. Solomon Raju, Arun Singh, and N. Purnachandra Rao |
| Sponsoring Agency | INCOIS(MOES) |
Work Description:
NGRI has established a 9 station seismological network in the Andaman Nicobar region (Fig29.1) to locate local earthquakes and estimate the site response beneath the stations. A minimum of 5 phases (3-P and 2-S) are considered for accurate locations. Earthquake with very small magnitudes (ML<3) are not well recorded at the southern stations like HUTB and KAMO, so these stations are not considered while locating these earthquakes. A total of 1649 local earthquakes have been located during the period April 2009 to December 2012 (Fig.29.2). Of these, 1639 have ML< 5 and only 10 have ML>5; the largest recorded magnitude being ML 6.2. The Root Mean Square (RMS) residual ranges from 0.2-1.3 sec. Thus the arrival times provide a reasonably consistent and reliable dataset for the analysis of seismicity. The seismicity trends clearly indicate that
i) majority of the earthquakes clustered to the west of the north Andaman Islands
ii)a clear increase of earthquake depths from west to east, suggestive of a benioff zone
iii) earthquakes tend to cluster between 20 and 40km depths
iv) the region to the west of the Narcondam islands is seismically more active compared to the other regions in the Andaman arc.
Use of ambient noise in the determination of the predominant frequencies and amplification values has been extensively used globally in trying to quantify the site specific seismic hazard for a given region. In this study the H/V ratios are calculated using both the ambient noise and the local earthquakes data. The H/V spectral ratio or the site response curves at all stations shows a clear peak in all the averaged NHV (Noise H/V) spectral ratio curves providing estimates of site amplification and the corresponding frequencies (Fig.29.3). The lower frequencies correspond to a large thickness of the top layer, while the higher frequencies correspond to lower thicknesses. Similarly, the high amplification corresponds to a strong impedance contrast of the top layer with respect to the basement unlike in the case of a low impedance contrast. The site response curves at all the stations in the network show different characteristics and can be categorized as Type-I, displaying clear peak amplifications (1.21-8.60)in the frequency range of 0.6-8 Hz. Station KAMO in south Andaman shows a single peak which is not observed at any of the other stations, suggesting a high impedance contrast between the top soil/sediment cover and the basement. Although the maximum amplification does not yield any direct information, amplification values exceeding 4 are associated with a sharp discontinuity and a large shear velocity contrast. Further, these Type-I response curves reveal an interesting phenomenon of de-amplification at stations HUTB, MYB, SBY, CBY and BARA, suggesting intercalation of soft and hard rock formations. Most of the southern stations have high amplifications at lower frequencies and the higher latitude stations have de-amplification effects. The distinct decrease in amplification values corresponding to dominant frequencies from South to North can be interpreted in terms of a decrease in soil/sedimentary thickness.
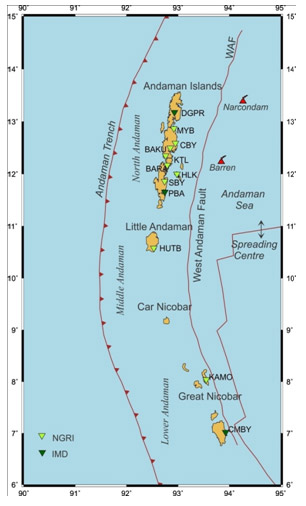
Fig.29.1:
Locations of broadband seismological stations (WAF, West Andaman fault).
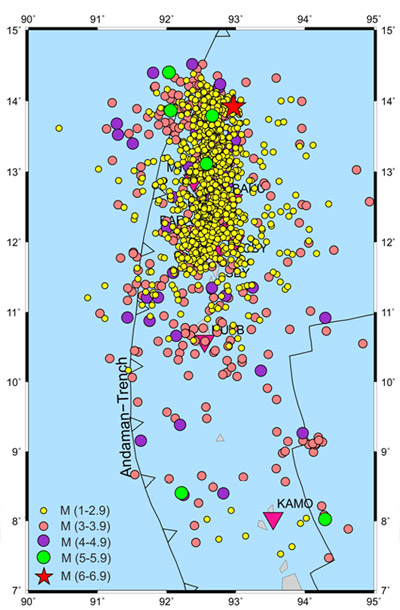
Fig.29.2:
Epicentral map of local earthquakes.
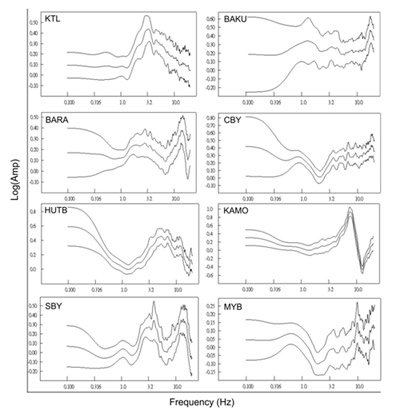
Fig.29.3:
H/V spectral ratio plots with their standard deviations obtained by the ambient noise recorded by NGRI stations
| Title | Measurement of Magnetic Variations along Southern Indian ocean-continent margin and adjoining islands to study crust/upper mantle structure through induction modelling, with focus on the deformation processes in Andaman arc. |
|---|---|
| Participants | Kusumita Arora, S.R.Sannasi, K.C.S Rao, L.Manjula, C.H.Gattaih, N.Phani Chandrasekhar and Ankit kumar |
| Sponsoring Agency | MoEs |
Work Description:
Three component fluxgate magnetometers have been installed at three Equatorial sites in the southernmost parts of India, shown in Fig 30.1. Processing of earlier data acquired over 2010-2012 from three locations are being processed and evaluated for ionospheric characteristics and anomalous induced effectsalong with new observations: baseline calculations, Electrojet and Counter Electrojet characterization, variability studies, spectral decomposition, etc. are being carried out at various stages of completion.
All the above magnetometers are placed in a non-magnetic wooden hut of 3’x3’x3’, weather-proof (plastic) housing with 12VDC battery, charged with a solar panel. Once in six months data is retrieved from FLASH CARD and downloaded in to computer for further analysis. Visits to all operating remote stations continue on a regular schedule and retrieved data has been processed and analysed for every 6 months. During this period simultaneous absolute observations are carried out for the estimation of Declination & Inclination of magnetic field for the construction of baseline in the remote sites.
Baselines measurements: Fig 30.2 shows the baselines for VEN as a sample from Sep 2010- Aug 2013 for all the three components. Interpolation method was used to extract the baselines from the give input for every six months. As once in six months the Absolute measurements are carried out at remote sites, by using the above method, baselines are developed for the entire period of data.
Spectral analysis of low-pass (>4 hr) and high-pass (<4 hr) variations in all components of variation data from PBR, VEN, and CBY along with HYB, has commenced. Preliminarily VEN data was computed and found the signatures of anomalous induced effects.Figure (3a) shows the high pass filtered data of Vencode ‘H’ field component is more anomalous than ‘Z’ component and ‘D’ during Disturbed day. Maximum amplitude of ‘H’ component is about 240 nT. Maximum amplitude vertical field component is about 100 nT. In frequency series amplitude is higher at high frequency this means that geomagnetic activity is more extensive at high frequency. In the low pass filtered data (Figure 5b) of Vencode ‘H’ field component is more anomalous than vertical component and the declination.In frequency series amplitude is lower at low frequency this means that geomagnetic activity is more intensive at low frequency. Both high and low pass filtered data are show the disturbed day.
A large number of Counter Electrojet (CEJ) events are recorded in this dataset exhibit a distinct difference in occurrence pattern at VEN and CBY, indicating that various CEJ currents are generated by winds over a short duration of 2-3 hr. Persistence of CEJ at VEN, with greater amplitude, but not at CBY is another new finding in the analysis.
The day-to-day variability of Ionospheric contributions to regular magnetic field variations was characterized over this region. Diurnal ranges observed at VEN and CBY are compared with the current density of Equatorial Electrojet Model (EEJM-2.0) and the departures in the observed data set shown in fig 30.3, with the model may be explained by local ionospheric processes associated with interactions between migrating, non-migrating atmospheric tides and also local wind shears.
Demonstrable results linking variability of magnetic variations, to ionosphere-atmosphere interactions have been found at equatorial stations (CBY and VEN) separated in longitude by 15 ο, along with (HYB and PBR) forming the first ever Electrojet pairs in the Indian region.
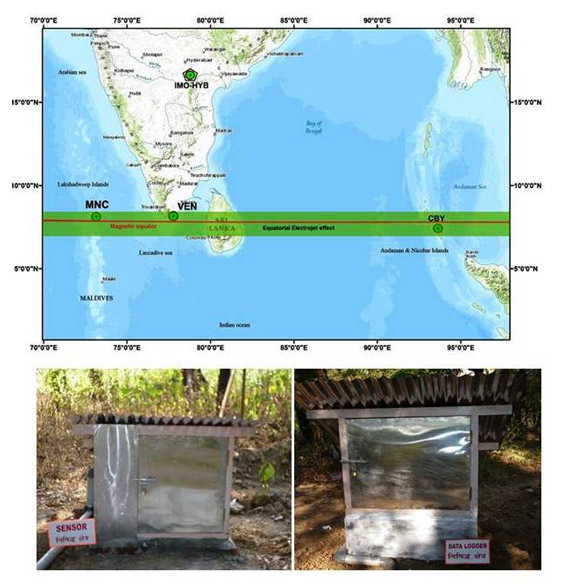
Fig.30.1:
Map showing the location of remote equatorial sites along with IMO-HYB (top pannel) and the non-magnetic hut along with data logger room (bottom pannel)
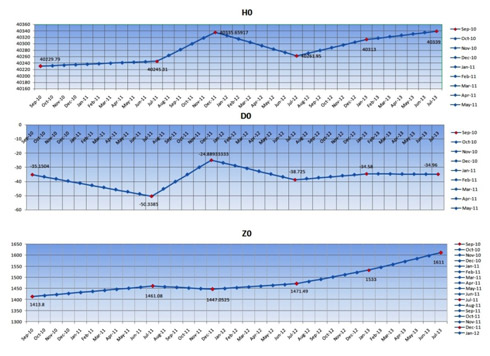
Fig.30.2:
Baselines of VEN for all the compoenents
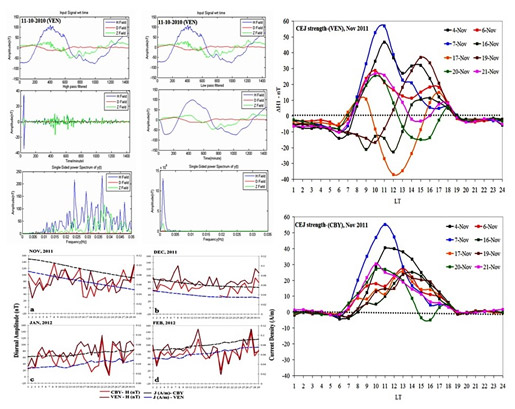
Fig.30.3:
Power spectra of H,D and Z compoenets, Diurnal ranges with CHAMP current density model and the observed CEJ during the period of study
| Title | Late Quaternary paleoclimatic & paleoceanographic studies using isotopic and trace elemental proxies from ocean sediments, corals and speleothems |
|---|---|
| Participants | Syed Masood Ahmad; Netramani Sagar; K. Venkatesham; Waseem Raza; G. Suseela; Mahjoor A. Lone; Shilpa Vuba; Tabish Raza; Sadia Farnaaz |
| Sponsoring Agency | CSIR- NGRI |
Work Description:
Speleothem δ18O based high-resolution record of Indian summer monsoon (ISM) variability during the last deglaciation
A high-resolution record of Indian summer monsoon (ISM) variability during the last deglaciation has been generated using δ18O values from a cave deposit (speleothem - stalagmite), located in the Kurnool district of Andhra Pradesh. This record covers a time span of 1,000 yrs from 15,700 to 14,700 yr BP with an average sampling resolution of ~5 yrs. High amplitude δ18O variations in this record suggest abrupt changes in ISM activity during the last deglaciation (Figure-31.1) and reveal the possible onset timing of Termination 1a at ~14,800 in Indian region 12:16:39 which is generally characterized by a major climate transition. Coincident variability in VSPM4 δ18O record with speleothems from southern China suggests that the Chinese caves also reflect fluctuations in ISM variability. The variance in δ18O amplitude of VSPM4 record reveals significant multidecadal ISM variability. Our record depicts some intense monsoon events during the later phase of Heinrich event (H1) and shows synchronous variability between ISM and East Asian monsoon (EAM). Spectral analysis of our δ18O time series reveals solar forcing and strong ocean-atmospheric circulation control on ISM dynamics during the studied time interval.
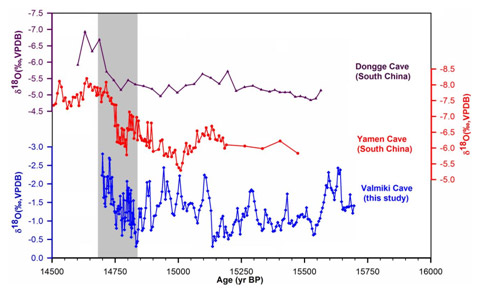
Fig.31.1:
Oxygen isotopic record of stalagmite from a Kurnool cave (Valmiki cave) compared with records from Chinese caves. Depleted del 18O values suggest intensification of monsoon precipitation.
(Mahjoor A. Lone, S. Masood Ahmad, Waseem Raza, K. Venkatesham and G. Suseela)
| Title | Oxygen isotopic evidence for decrease in calcification rate of Porites coral from the Lakshadweep Island |
|---|
Work Description:
Scleractinian (stony) corals are formed exclusively under marine environment in tropical regions. The skeletons of scleractinian corals (eg. genus Porites) provide an unaltered record of the chemical and physical conditions that existed in the surrounding seawater at the time of their formation. Living scleractinian corals provide an excellent archive of paleoclimatic records covering the past few decades to several hundreds of years. As growth-rate in these corals is generally high (~ 1-2 cm/yr) they preserve records of past climate, oceanographic and monsoonal changes on weekly to monthly time resolution. However such reef-building corals are under tremendous physiological stress due to the changing climate and industrial pollution. The main threats to coral reefs are caused by increasing sea surface temperature (SST) and ocean acidification.
We have generated a very high-resolution record of sea surface temperature (SST) changes from a drilled coral colony of Lakshadweep island (Kavaratti). Our aim was to to investigate seasonal changes in coral’s skeleton due to climate / anthropogenic changes. Interestingly we have observed a significant decrease in calcification rate (~10-15%) in a scleractinian coral (Porites lutea) from this island in recent years. This observation is based on high-resolution oxygen isotopic record (Figure-32.1) and X-radiography of coral. The reduction in the calcification rate of Porites coral from 1989 to 2003 A.D.is attributed to climate change and anthropogenic activity in the vicinity of coral growth. This decrease in calcification rate in Lakshadweep region is consistent with the decline in growth rate of genus Porites from the Great Barrier Reef (GBR).
Fig.32.1:
Oxygen isotopes and sea surface temperature (SST) curve from Kavaratti coral. SST values are calculated by standard temperature equation using oxygen isotopes of coral for the period from 1989 to 2003 AD
(S. Masood Ahmad, Netramani Sagar, Sadia Farnaaz, Waseem Raza, G. Suseela and K.Venkatesham)
| Title | Geochemical and mineralogical characteristics of recent clastic sediments from lower Godavari River: Implications to source rock weathering |
|---|
Work Description:
The major, trace and rare earth elements geochemistry and clay mineral compositions in bed sediments from lower reaches of Godavari River suggest that they are derived from weathering of felsic rocks. Trace and rare earth elemental compositions indicate evidence of sedimentary sorting during transportation and deposition. Lower concentrations of transition elements, such as V, Ni and Cr imply enrichment of felsic minerals in these bed sediments. The REE pattern in lower Godavari sediments is influenced by the degree of source rock weathering. The light rare earth elements (LREE) content are indicating greater fractionation compared to the heavy rare earth elements (HREE). A striking relationship is observed between TiO2 and ∑REE content suggesting a strong control by LREE-enriched titaniferous minerals on REE chemistry. Shale-normalized REE pattern demonstrates a positive Eu anomaly (Figure 33.1), suggesting weathering of feldspar and their secondary products, which are enriched in Eu. Chondrite-normalised REE pattern is characteristic of felsic volcanic, granites and gneissic source rocks. Trace elemental compositions in sediments located near urban areas suggest influence of anthropogenic contamination. Chemical Index of Alteration (CIA) is high (avg. 65.76), suggesting a moderate chemical weathering environment. X-ray diffraction analysis in clay fraction shows predominance of clay minerals that are formed because of the chemical weathering of felsic rocks.
(Shilpa Vuba, S. Masood Ahmad, Sadia Farnaaz and Netramani Sagar)
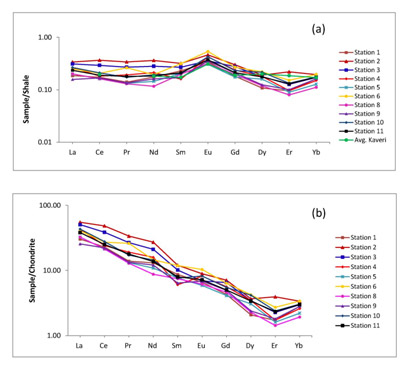
Fig.33.1:
Shale normalized and chondrite normalized REE patter of lower Godavari sediments.
| Title | The Structure and dynamics of groundwater systems in northwestern India under past, present and future climates |
|---|---|
| Participants | Dewashish Kumar, Setbandhu Mondal, V.S. Sarma and Mrinal K. Sen |
| Sponsoring Agency | MOES – Grant-in-Aid |
Work Description:
Introduction
Even the minute variation in the resistivity of the subsurface formations related to sand/soil texture, moisture content and porosity variation can be mapped in terms of resistivity values and contrast. The presence of buried channel (dry and hard sand formation) is very well resolved from the present 2D resistivity tomography dataset. The discontinuity within the buried channel is clearly visible from the inverted 2D resistivity sections as revealed from the results at different sites. These channels are possibly the indicators of groundwater reserves and could be exploited – a precious resource as and when on demand and need.
Study Area
Geology and Geomorphology
The Ghaggar river basin covers an area of about 42,200 km2 extending over parts of several states in northwestern India namely Haryana, Himachal Pradesh, Punjab, Rajasthan and the Union territory of Chandigarh (fig.34.1). The Ghaggar basin is a part of the large Indo-Gangatic Quaternary basin, which is filled with many hundreds of meters of alluvial deposits. The Ghaggar is mainly a rainfed river and it carries base flow throughout the year only in its upper reaches. It flows across the basin for a distance of 560 km from the Siwalik Hills, through the states of Haryana, Punjab and Rajasthan to the flood plain and natural depressions in the south-west part of the basin. The Markanda and Dangri rivers meet the Ghaggar near Tatiana. The mean temperature is between 37oC and 45oC.
Materials and Methods
In the present study, ERT investigaton was carried out at 18 profilesalong11.34 km line across the Ghaggar river system of northwestern India. The resistivity field data is first processed for eliminating any noisy or bad data points in the gathered data set and later depending on the smoothness of resistivity data damping and mesh parameters had been assigned to the individual data set in order to achieve realistic subsurface resistivity models. The processed and filtered data is inverted using least squares inverse approach with smoothness constrained (Sasaki, 1992; Loke, 1997, 1997a) and with a standard Gauss-Newton optimization technique using Res2DINV software. This actually reproduces an approximate subsurface resistivity variation with depth both in lateral and vertical direction. The inverted 2D resistivity section, which is an approximation to the subsurface formation resistivity in turn finally is interpreted in terms of geology, structure and hydrogeology in the present hydrogeological context.
Interpretation of 2D Electrical Resistivity Tomography Dataset
Profile -TN-3
2D inverted resistivity model shows uniform variation in resistivity of the subsurface lithological units (fig.34.2). The model shows thick band of compact sand with a resistivity of 300-500 Ohm.m at a depth of 20m, which is comparatively thicker in eastern side. This confined aquifer is clearly delineated at a depth of ~55 m (fig.34.2) showing potential aquifer of sand saturated with water with resistivity of the order of 10-35 Ohm.m.
Profile - KA-2
The inverted resistivity model shows hard sand layer (light brown to red layer) with a resistivity range of 170-500 Ohm.m at 25m depth. This clearly indicates the presence of buried palaeochannel throughout the section, which might be active and productive in the past but at present acting as a hard sand layer (fig.34.2). This layer is overlain by the younger sediments which act as an active channel source in the shallower part of the alluvium formation. This is subsequently followed by fine sand/silt and then medium sand layer with variation in texture of sand and moisture content of the formation. The large dimension of aquifer system within sandy formation (sky blue to blue colour) is clearly delineated at a depth of 70m, which is fully saturated with water (fig.34.1) and is under confined condition.
Discussion on results of 2D resistivity dataset
2D resistivity sections in and around Punjab and Haryana of northwest India revealed that the subsurface consists of sedimentary formations underlain by 6 to 7 major stratified layers. But at a few sites, the layers are highly disturbed and are quite heterogeneous in nature signifying the palaeochannel signature and meandering nature. The alternate bands of sand and silty layers of varying thickness are delineated from the 2D inverted resistivity models.
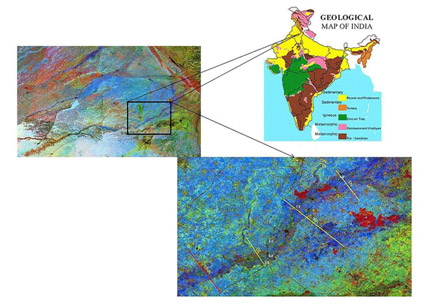
Fig.34.1:
Figure showing the landsat imagery showing near surface palaeochannel in alluvium aquifer of the Ghaggar river system in Northwestern India : Yellow lines are the 2D resistivity tomography profiles across the palaeochannel
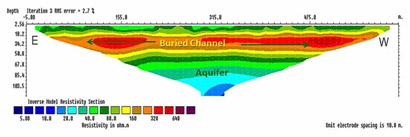
Fig.34.2:
Shows the 2D inverted resistivity section along Tatiana Site (TN -3) with clear cut buried channel anomaly with consistent thickness and its lateral extension along with the aquifer zone
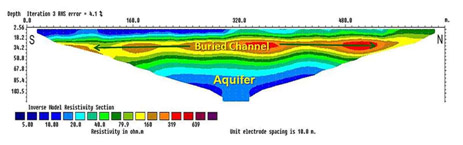
Fig.34.3:
Shows the 2D inverted resistivity section along Kasaur Site (KA -2) delineating the buried channel anomaly with variable thickness and its lateral extension along with the aquifer zone
| Title | Petrophysical properties of the entire Deccan basalt stratigraphy: Sample collection campaign |
|---|
Work Description:
The Deccan volcanic province is an important large igneous province in the world, as it marks the Cretaceous-Palaeogene boundary that witnessed a global change of climate and biogeosphere. The Deccan province currently exposes about 500,000 km2 of basaltic lava flows with a stratigraphic thickness of more than three kilometers. It is underlain by Precambrian rocks and Gondwana sedimentary rocks. The Deccan Group of lava flows consists of three Subgroups: Kalsubai, Lonavala and Wai. The Kalsubai Subgroup form the lower level of the succession, containing Jawhar, Igatpuri, Neral, Thakurvadi, Bhimashankar Formations. It is overlain by Lonavala Subgroup that consists of Khandala and Bushe Formations. The Wai Subgroup containing Poladpur, Ambenali, Mahabaleshwar, Panhala and Desur Formations comprise the upper level of the sequence. A number of individual lava flows constitute each formation. The Wai Subgroup constitutes about 50% of the Deccan volcanic province, while the Kalsubai and Lonavala Subgroups make up the rest of the sequence. The startigraphy of the Deccan basalt was established based on field, geochemical and palaomagnetic data. The complete stratigraphic sequence of the Deccan basalts is well exposed on the Western Ghats escarpment, which is a spectacular geomorphic feature that divides the Konkan coastal plains in the west and the Deccan plateau in the east. The Western Ghats escarpment provides a great opportunity to petrologists and geochemists to sample the basaltic lava flows of all formations for documenting the petrological and geochemical stratigraphy. Although geochemical stratigraphy of the Deccan basalts is well established, there has been no study on how petrophysical properties (e.g., density, compressional and shear wave velocity, and porosity) vary between different formations of the Deccan basalts. Therefore, we started a research project to characterize the entire Deccan basalt sequence, exposed on the Western Ghats escarpment. For this, we have selected four regional traverses: (1) Nasik – Jawhar, (2) Pune – Lonawala, (3) Mahad-Mahabaleshwar and (4) Chiplun – Koyna. These traverses covered 11 Formations of the Deccan basalts. We collected 158 block samples along these traverses (Figure 35.1). We collected 20 cm × 20 cm × 20 cm size block rock samples from fresh rock exposures on the quarry walls and road cuttings without any alteration. These samples preserve original mineralogical, petrographic and micro-structures. From the block samples, we are obtaining three to five cylindrical cores (30 mm diameter and 60 mm length) at different orientations, which account for textural and mineralogical anisotropy in the rocks. These samples will be characterized in the near future for obtaining petrophysical properties.
2. A study of the Western Ghats escarpment around Mahabaleshwar and Koyna
We present petrophysical properties (density, P and S wave velocity, porosity and Poisson's ratio) of the Deccan basalts from the Western Ghats escarpment around Mahabaleshwar and Koyna and characterize the Dhawar basement rocks around Goa. This study presents the petrophysical stratigraphy of the southwestern Deccan Traps for the first time. These properties would grossly reflect the compositional variation, textural properties, and vesicles/amygdales. The Western Ghats sections near Mahabaleshwar expose more than a kilometer thick basaltic sequence belonging to Bushe, Poladpur, Ambenali and Mahabaleshwar Formations, which represent the upper levels of the sequence, widespread in the southwestern Deccan Traps region. We collected fresh quarry samples of basalts from the Mahabaleshwar and Koyna sections and the Dharwar basement rocks (granites, gneisses, and greywackes) from Goa area. This study is aimed at understanding the petrophysical properties that would reflect the original petrological characteristics, but not the effect of weathering on these properties. In the 1300 m thick Mahabaleshwar section, the basalts show a considerable variation between the Formations (Figure 35.2). The Bushe Formation is characterized by a wide range in these properties, low density (2.61 g/cm3), P-wave (4.53 km/s) and S-wave velocity (2.74 km/s), and high porosity (4.6%). The Poladpur and Ambenali Formations show a narrow range, but higher density and velocities, but lower porosity. The Poladpur Formation is characterized by the mean density of 2.9 g/cm3, P-wave velocity (5.78 km/s), S-wave velocity (3.32 km/s), and porosity (1.3%). The Ambenali Formation is similar to the Poladpur Formation, has a mean density of 2.9 g/cm3, P-wave velocity (5.78 km/s), S-wave velocity (3.30 km/s), and porosity (1.2%). In contrast, the Mahabaleshwar Formation shows a wide variation in these properties, but has higher density (2.86 g/cm3), P-wave velocity (5.61 km/s) and S-wave velocity (3.20 km/s), and porosity (2.3%), compared to the Bushe Formation. In the 750 m thick Koyna section, the basalt samples are broadly similar to the Poladpur and Ambenali Formations of the Mahabaleshwar section (mean density: 2.94 g/cm3, P-wave velocity: 5.70 km/s, S-wave velocity: 3.29 km/s) (Figure 35.3). The Dhawar rocks (granites/gneisses and greywackes) exposed in and around Goa represent the basement of the basaltic sequence around Koyna-Mahabaleshwar region. They are characterized by lower density (2.63 and 2.76 g/cm3), P-wave velocity (5.13 km/s and 5.52 km/s) and S-wave velocity (3.15 and 3.40 km/s), respectively (Figure 35.3). This study clearly documents the lateral and vertical variation of density, velocity, and porosity in the Deccan basalts, which are very sensitive to the vesicle/amygdale content of the flows that depend on the volatile release from these lavas. The petrophysical stratigraphy is also broadly similar to the geochemical stratigraphy. Gravity and seismic studies in these regions would greatly benefit from the present study, because precise models of the subsurface density and velocity structures from the field geophysical data requires inputs from the measurements of petrophysical properties of the rocks in these regions. The Poisson's ratio of the Deccan basalts is largely affected by the vesicular porosity, aspect ratio of the amygdales, and zeolite content. High porosity of the Bushe and Mahabaleshwar Formations constitute a multi-layered aquifer system in the Deccan volcanic province. In the Koyna earthquake zone, these formations may provide an effective groundwater connectivity between the reservoir and earthquake focal areas. The new petrophysical data of the Deccan basalts and Dharwar basement rocks will help to refine the geophysical models of the southwestern Deccan basalt province.

Fig.35.1:
ASTER DEM showing the topography and sample locations.
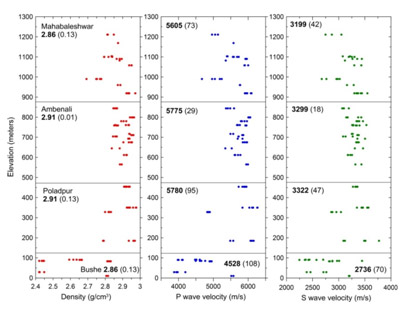
Fig.35.2:
Petrophysical stratigraphy of the Deccan basalts in and around Mahabaleshwar.

Fig.35.3:
Petrophysical data of Koyna basalt and Dharwar basement rocks.
| Title | Attenuation Character of Seismic Waves in Sikkim Himalaya |
|---|---|
| Participants | Pinki Hazarika, M. Ravi Kumar |
| Sponsoring Agency | CSIR-NGRI |
Work Description:
In this study, we investigate the seismic wave attenuation beneath Sikkim Himalaya using P, S and coda waves from 68 local earthquakes registered by eight broad-band stations of the SIKKIM network (Fig. 36.1, Fig. 36.2). The attenuation quality factor (Q) depends on frequency as well as lapse time and depth. The value of Q varies from
(i) 141 to 639 for P waves,
(ii) 143 to 1108 for S waves and
(iii) 274 to 1678 for coda waves, at central frequencies of 1.5 Hz and 9 Hz, respectively. The relations that govern the attenuation versus frequency are Qα = (96 ± 0.9) f (0.94 ± 0.01), Qβ= (100 ± 1.4) f (1.16 ± 0.01) and Qc= (189 ± 1.5) f (1.2 ± 0.01) for P, S and coda waves, respectively (Fig. 36.3). The ratio between Qβ and Qα is larger than unity, implying larger attenuation of P compared to S waves. Also, the values of Qc are higher than Qβ . Estimation of the relative contribution of intrinsic (Qi) and scattering (Qs) attenuation reveals that the former mechanism is dominant in Sikkim Himalaya. We note that the estimates of Qc lie in between Qi and Qs and are very close to Qi at lower frequencies. This is in agreement with the theoretical and laboratory experiments. The strong frequency and depth dependence of the attenuation quality factor suggests a highly heterogeneous crust beneath the Sikkim Himalaya. Also, the high Q values estimated for this region compared to the other segments of Himalaya can be reconciled in terms of moderate seismic activity, unlike rest of the Himalaya, which is seismically more active.
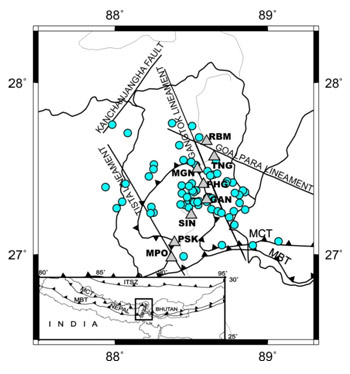
Fig.36.1:
Map of Sikkim Himalaya with the major tectonic features showing the locations of earthquakes (circles) and seismic stations (triangles) used in this study. Bottom panel shows a simplified tectonic map of central and eastern Himalaya enclosing Sikkim with an open rectangle.
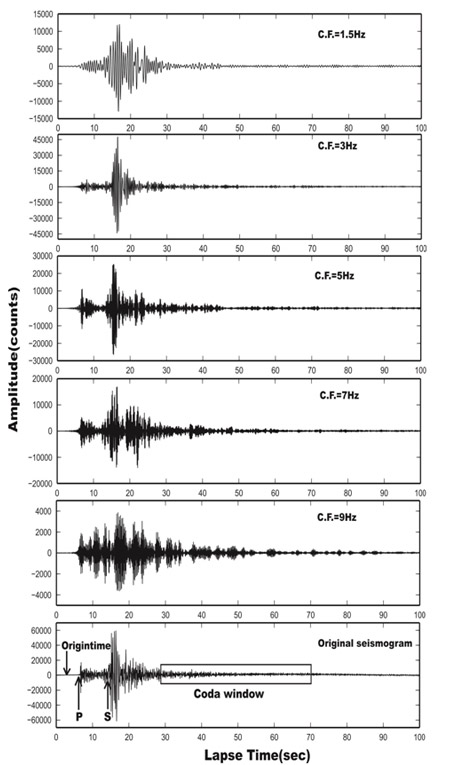
Fig.36.2:
Examples of original and filtered seismograms recorded at seismic station MPO due to an earthquake that occurred on 2006 May 3.
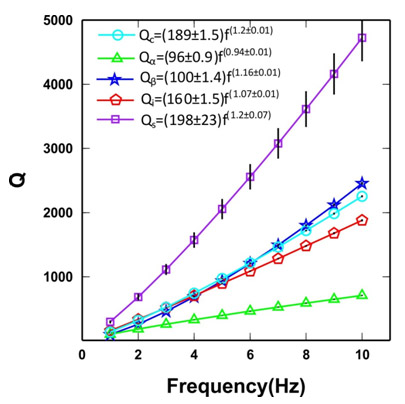
Fig.36.3:
Plot showing the frequency dependency of Qc, Qα, Qβ , Qi and Qs values estimated in this study for Sikkim Himalaya.
| Title | Geodynamic evolution of Lohit plutonic complex, in Eastern syntaxial belt & Deformation partitioning in active Sub-Himalayan mountain front, NE Himalaya |
|---|---|
| Participants | Anand K Pandey (ID 994) & Prabha Pandey (ID 1049) |
| Sponsoring Agency | CSIR-NGRI |
Work Description:
- Preliminary landform mapping (geomorphic expressions) in Himalayan mountain front of NE Himalaya using data from earlier studies , Satelite imagery and published literature along Itanagar section of Arunachal Pradesh is in progress.
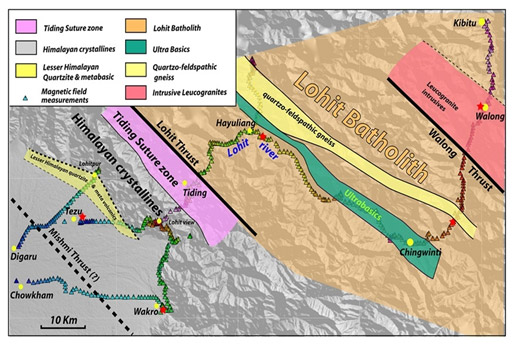
Fig.37.1:
Preliminary geological map along the Lohit valley section in NE Himalaya.
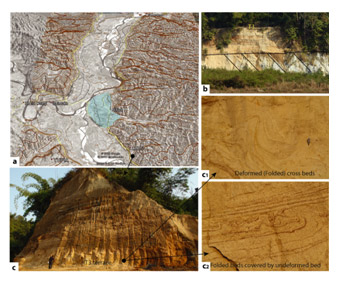
Fig.37.2:
Geomorphic and stratigraphic expressions of active deformation in Himalayan front.
- (a) Digitally processed Cartoset-II image overlaid with contour showing distribution of fluvial terreces and fans along the Dikrang river section in NE Sub Himalaya.
- (b) The growth of strath terraces over steeply dipping Siwalik beds, suggesting active deformation and incision.
- (c) Section of T3 terrace exposed in the road cutting showing soft sediment deformation as (c1) deformed cross bedding, (c2) folded bed and pseudonodules bordered by undeformed bed suggesting discreet deformation events.
| Title | Near-Surface Shear Velocities in Diverse Geological Segments of India |
|---|---|
| Participants | Singh, M. Ravi Kumar, D. Srinagesh |
| Sponsoring Agency | CSIR-NGRI |
Work Description:
- In this study we investigate the near-surface shear velocities beneath 144 broadband seismic stations of India that span diverse geological terrains, using nearly 37,635 good quality (SNR ≥ 2.5) three-component waveforms from 3849 earthquakes (Fig.38.1). The results suggest lower shear velocities beneath regions of large sedimentation, with the lowest in the range of ~1 km/s observed for the Indo-Gangetic plains (Fig.38.2). These low velocity estimates show a dependence on frequency, implying velocity changes with depth. Segments that represent the Precambrian shield reveal high shear velocities in the range of 3.2 to 3.4 km/s, akin to global observations. The mountain ranges that constitute the Himalaya and southern Tibet have intermediate velocities primarily ranging from 2.8 to 3.0 km/s . Overall, the near-surface shear velocities seem to be correlated with the local geology and provide inputs for site-specific hazard assessment in terms of predicting strong ground motions due to scenario earthquakes.
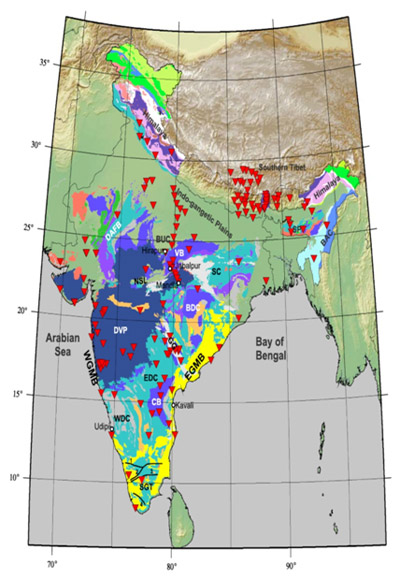
Fig.38.1:
Location of broadband seismic stations (inverted triangles) on the Indian subcontinent superimposed on the geology. SGT, southern granulite terrain; EDC, eastern Dharwar craton; WDC, western Dharwar craton; DVP, Deccan volcanic province; CB, Cuddapah basin; GG, Godavari graben; SC, Singhbhum craton; BDC, Bhandara craton; VB, Vindhyan basin; BUC, Bundelkhand craton; DAFB, Delhi-Aravalli fold belt; SP, Shillong plateau; BAC, Burmese arc; 1, Moyar; 2, Bhavani; 3, Palghat-Cauvery; 4, Achan-Kovil shear zones.
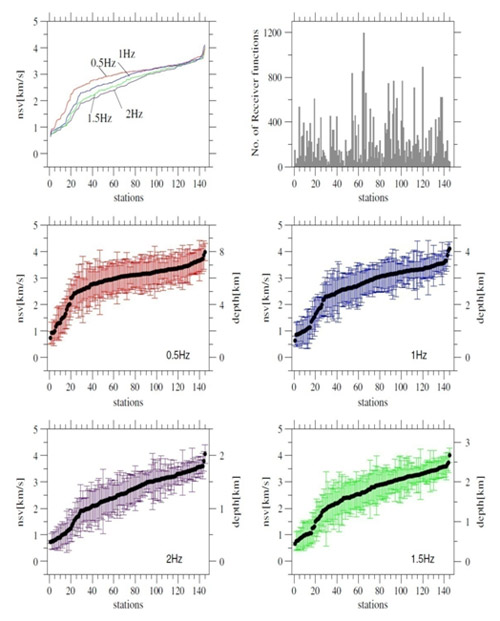
Fig.38.2:
Estimates of the near-surface shear velocities at each station at different frequencies indicated, along with their 2 sigma errors and depths of investigation (middle and bottom panels). Top left panel: Mean values at the four frequencies. Top right panel: Number of receiver functions used at each station
| Title | Triggering of 2005 earthquake swarm in the Andaman Sea |
|---|---|
| Participants | Kalpna Gahalaut |
| Sponsoring Agency | CSIR-NGRI |
Work Description:
- In this study a detailed analysis for the 2005 volcano-tectonic earthquake swarm in the Andaman Sea (Fig.39.1) was performed. Its spatio-temporal evolution, characteristics and possible mechanism involving time-dependent pore pressure induced stress modification suggest that the swarm was of volcano-tectonic origin and fluid flow played an important role in its occurrence (Fig.39.2). Further, our modeling suggests that it was triggered by the 2004 Sumatra-Andaman earthquake through poroelastic relaxation of the coseismic stress (Fig.39.3)
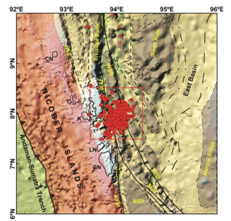
Fig.39.1:
Location map of 2005 Andaman Sea swarm along with detailed tectonic features. The 2004 Sumatra-Andaman earthquake rupture in the Andaman Nicobar and Sumatra frontal arc is shown by red shading. EMF, Eastern Marginal Fault; SFS, Sumatra Fault System; WAF, West Andaman Fault; SEU, Seulimeum Strand of SFS; WSR, West Sewell Ridge; NSR, North Sumatra Ridge; CN, Car Nicobar Island; T, Teresa Island; K, Katchall Island; LN, Little Nicobar Island; GN, Great Nicobar Island.
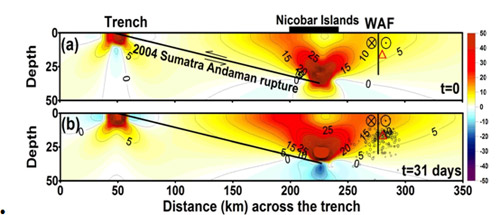
Fig.39.2:
Temporal evolution of pore fluid pressure induced change in Coulomb stress (bar) due to coseismic slip on the 2004 Sumatra-Andaman earthquake rupture, in a northeast-southwest vertical cross section in the Nicobar region. Coulomb stress change is resolved on the dextral strike-slip WAF. (a) Instantaneous change in Coulomb stress due to the earthquake and (b) its poroelastic relaxation.
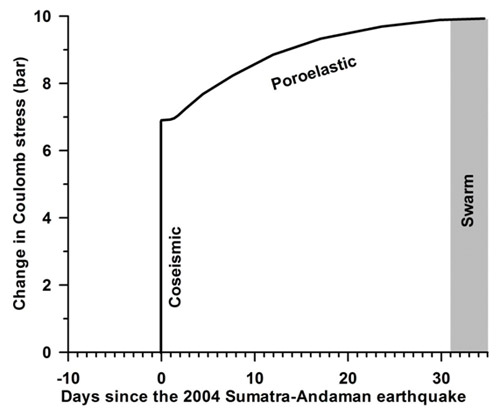
Fig.39.3:
Temporal evolution of change in Coulomb stress on the West Andaman Fault (WAF) at 20 km depth (red triangle in Figure 2). Note the effective increase in the Coulomb stress change from about 7 bars (due to the 26 December 2004 Sumatra-Andaman earthquake) to about 10 bars on the day of initiation of the 2005 swarm).
| Title | Conductivity structure of Andaman Nicobar subduction zone from electromagnetic induction studies |
|---|---|
| Participants | Kusumita Arora, S.R.Sannasi, K.C.S Rao, L.Manjula, C.H.Gattaih, Gangadhar and Suraj Kumar |
| Sponsoring Agency | CSIR-NGRI |
Work Description:
In order to construct the regional conductivity structure of the Andaman Nicobar subduction zone, two sites have been selected in the north and middle part of the island chain and 3-component fluxgate magnetometers have been installed there (Fig. 40.1). Local magneto variational sounding (MVS) based on the inversion of frequency responses of the tipper can be used not only to reflect the geoelectric asymmetry of the medium but also provide constraints on its stratification, i.e., enables the construction of layered inhomogeneous sections. The magnetic variation data from the two sites would be used for this purpose. Sample calculations of tippers from previous data from south India are being carried out simultaneously.
Days of high amplitude disturbances have been selected from several months of data
Using matlab program which calculates the everyday spectra of horizontal field component(H),declination and vertical field component(Z) afterdetrending this raw data and then apply high pass filter and then apply fast fourier transform which convert the time series to frequency series and get the spectra of frequency spectrum for H,D and Z field (Fig.40.2).
For the selected frequency band, the induction matrix is calculated. In the calculation of induction vector, we have taken high amplitude from z-component which is dominant for induction, H and D were taken corresponding to Z-component. After calculating H,D and Z component from the frequency spectrum the conjugate of H,D,Z. This H,D,Z is calculated and induction matrixis generated with the use of matlab program which is showed in the form of a flow chart (Fig 40.3a). The induction vector plot at particular coordinate (7 ,78) using different frequency band. In Fig 40.3b blue vector correspond to real part and red vector correspond to imaginary part.
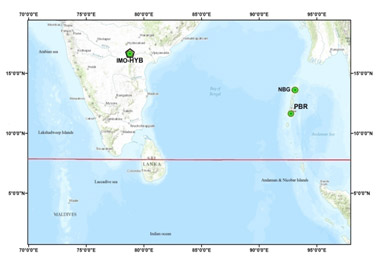
Fig.40.1:
Map showing the location of remote sites at Portblair (PBR) ,Nabagram (NBG) along with IMO-HYB.
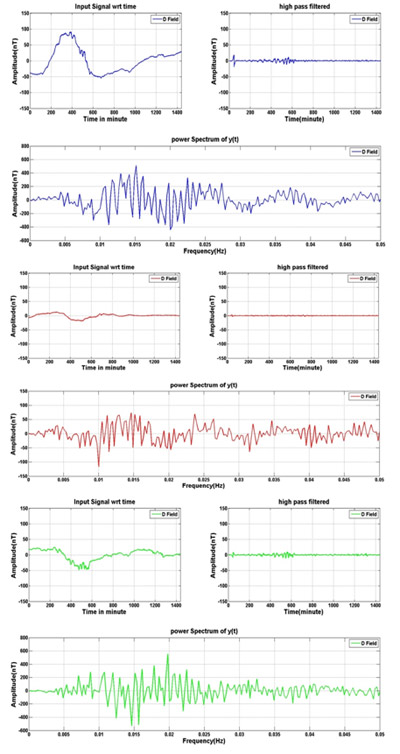
Fig.40.2:
Frequency spectrum for H,D and Z components of geomagnetic field
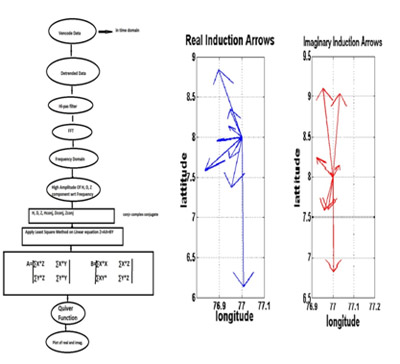
Fig.40.3 (a,b):
Flow chart showing the computation of induction vector (left pannel) and Real and imaginary parts of calculated induction arrows (right pannel)
| Title | Novel techniques for geophysical modeling |
|---|---|
| Participants | S K Ghosh, A Vasanthi |
| Sponsoring Agency | CSIR |
Work Description:
1. Extraction of symmetric and antisymmetric signals embedded in Gaussian white noise.
We begin with symmetric signals and focus first on finding its midpoint of symmetry. Two methods have been developed to meet this goal.
- (a) In the first method, the noisy trace and its time reverse are cross correlated. Given a favourable signal to noise ratio, the peak of the cross correlation and the corresponding time lag provide a clue for the location of the midpoint of symmetry of the signal.
- (b) In the second method, we conceive of a cyclic permutation of the noisy trace in which each point on the trace is made, turn by turn, the midpoint. For each choice, the trace is split into its odd and even components with respect to its current midpoint. Then energies of the even and odd part and their difference are noted for each permutation. The choice of the midpoint which leads to the maximum energy difference is the location of the midpoint of symmetry of the symmetric signal.
- (c) We focus on the specific permutation resulting in the maximum energy difference and the corresponding even and odd components of the trace with respect to its midpoint. While the even component contains both signal and noise the odd component contains only noise. This step results in the exclusion of half the noise approximately. The odd component is useful in that it can provide the statistics of the noise.
- (d) Only the inner segment of the even component (called even trace hereafter) contains signal along with noise, while the segments on the fringes contains only noise. Our goal is to approximately determine the onset point of the signal. For this we first determine the statistics of the original Gaussian white noise. Its variance would be double the variance of the odd component. We generate several samples of the Gaussian white noise and split each into odd and even components about the midpoint of each of the noise trace. The even components would yield the statistics of the noise present in the even trace extracted earlier.
Several algorithms have been constructed to determine the onset of the signal in the even trace. All rely on the changed statistic of the trace after the signal sets in. For example when several consecutive values in the even trace exceed the standard deviation of the estimated noise, the signal can be thought to have set in. As safety margin, some points before the estimated onset are also included.
The points before the signal onset and those after the signal ends are now excluded from the even trace. This step enables a second phase of noise reduction. - (e) Assuming that the noise is of far wider band than the signal a similar approach as above is feasible in the frequency domain as well. This will determine the approximate band limit of the signal. Exclusion of energy outside this band will further increase signal to noise ratio. This results in a crude estimate of the signal.
- (f) Finally, a formula due to Wiener yields an improved estimate of the signal from a crude estimate.
Thus we have developed a method for locating and estimating a symmetric signal embedded in white noise. While Figure 41.1(a) depicts the symmetric signal embedded in noise, Figure 41.1(b) depicts the extracted signal on an overplot of the original signal. - (g) The method for extracting an antisymmetric signal is developed along a similar line involving the odd component of the signal plus noise trace. While Figure 41.2(a) depicts the anti-symmetric signal embedded in noise, Figure 41.2(b) depicts the extracted signal on an overplot of the original signal.
2. Extraction and location of a signal with a given phase
For a signal whose phase is known and which is embedded in noise, one can subtract the phase by transforming the noisy trace to the frequency domain. An inverse Fourier transform then results in a symmetric signal embedded in white noise. The steps for locating the signal and its extraction are then same as for a symmetric signal. The phase can be added to the symmetric signal after estimating it. While Figure 41.3(a) depicts the signal of a given phase embedded in noise, Figure 41.3(b) depicts the extracted signal on an overplot of the original signal.
3. Analysis of potential field data over Cauvery Basin
The analyses of gravity, magnetic and bathymetry data delineated a number of geologic features hitherto unreported with regard to the mosaic of the Cauvery Basin, such as a zone of subsidence and especially the focal region of the 2001 Pondicherry earthquake. The residual gravity and magnetic anomalies, derived by a relatively new finite element approach, reveal a good correspondence between the geophysical data on the one hand and the distribution of sedimentary rocks on the other. A positive residual gravity anomaly shows that the entire Cauvery Basin is subsiding.
4. Analysis of gravity signatures over Impact Craters
The sudden extinction of the dinosaurs was assigned to the catastrophic impact of an asteroid or comet with Earth around 65 ma ago. Large impacts beyond doubt played important roles in the evolution and development of life on Earth. These terrestrial bodies hit the Earth at very high velocities generating enormous heat and pressure. In general, the densities of these bodies and the rocks at the surface of the Earth vary considerably, thereby making gravity method admirably suitable for identification and exploration of the impact structures. Gravity method has been widely used to determine the shape, size of the crater and the mass deficiency. The Bouguer gravity data of three well known impact craters, namely, Manicouagan, Sudbury and Chicxulub from Canada and Mexico have been reprocessed in order to know the accurate tectonic framework and mass deficiency.
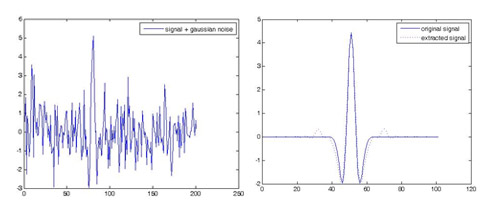
Fig.41.1:
(a) Symmetric signal embedded in noise, 1(b) Extracted signal on an overplot of the original signal.
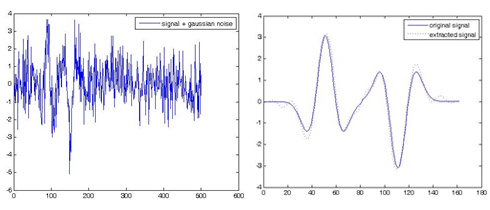
Fig.41.2:
(a) Anti-symmetric signal embedded in noise, 2(b) Extracted signal on an overplot of the original signal.
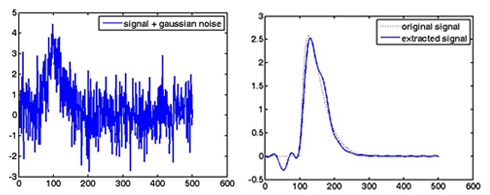
Fig.41.3 (a,b):
(a) Signal with a given phase embedded in noise, 3(b) Extracted signal on an overplot of the original signal.
| Title | Developing Insight into interaction between Mantle Processes and Crustal Tectonics: Gravity Perspective |
|---|---|
| Participants | Bijendra Singh, A.P.Singh, Niraj Kumar |
| Sponsoring Agency | CSIR-NGRI |
Work Description:
2-D lithospheric density modelling was carried out along three geotransects of more than 1000 km each crossing the southern Indian shield, south of 16◦N, in N–S and E–W directions. The model is based on the assumption of local isostatic equilibrium and is constrained by the topography, gravity and geoid anomalies, by geothermal data, and where available by seismic data. Our integrated modelling approach reveals a crustal configuration with the Moho depth varying from ∼40 km beneath the Dharwar Craton, and ∼39 km beneath the Southern Granulite Terrane to about 15–20 km beneath the adjoining oceans. The lithospheric thickness varies significantly along the three profiles from ∼70–100 km under the adjoining oceans to ∼130–135 km under the southern block of Southern Granulite Terrane including Sri Lanka and increasing gradually to ∼165–180 km beneath the northern block of Southern Granulite Terrane and the Dharwar Craton. The thin lithosphere below the southern block of Southern Granulite Terrane including Sri Lanka is, however, atypical considering its age. Our results suggest that the southern Indian shield as a whole cannot be supported isostatically only by thickened crust; a thin and hot lithosphere beneath the southern block of Southern Granulite Terrane including Sri Lanka is required to explain the high topography, gravity, geoid and crustal temperatures. The widespread thermal perturbation during Pan-African (550 Ma) metamorphism and the breakup of Gondwana during late Cretaceous are proposed as twin cause mechanism for the stretching and/or convective removal of the lower part of lithospheric mantle and its replacement by hotter and lighter asthenosphere in the southern block of Southern Granulite Terrane including Sri Lanka. Unusually thinned LAB beneath the region near Bangalore apparently indicates the preserved tectonocompositional effect of late Proterozoic rifted margin of Dharwar Craton.
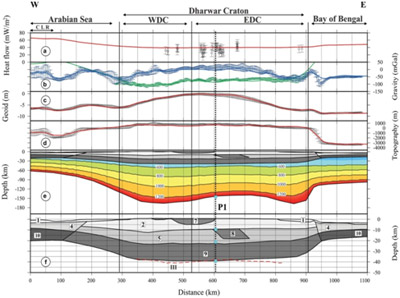
Fig.42.1:
Lithospheric model and observed and calculated response along W-E across Dharwar craton. Figs (a–(d), continuous lines correspond to calculated response of the initial model and dots with uncertainty bars correspond to measured data. blue line and symbols corresponds to free-air gravity anomalies, green ones to Bouguer anomalies.
| Title 1. Physical parameters of the different bodies used in the modelling | ||||
|---|---|---|---|---|
| No. | Description | HP (µWm-3) | TC(Wm-1 K-1) | Density (kg m-3 ) |
| 1 | Sediment | 1.0 | 2.0 | 2300 |
| 2 | Upper crust of Dharwar Craton | 0.5 | 3.3 | 2720 |
| 3 | Upper crust of Southern Granulite Terrane | 0.5 | 2.5 | 2730 |
| 4 | Oceanic upper crust | 0.5 | 2.5 | 2770 |
| 5 | Middle crust of Dharwar Craton | 0.25 | 2.5 | 2740 |
| 6 | Middle crust of Southern Granulite Terrane | 0.20 | 2.5 | 2800 |
| 7 | Intrusive | 0.5 | 2.5 | 2870 |
| 8 | Intrusive | 0.5 | 2.5 | 2890 |
| 9 | Lower continental crust of Dharwar Craton | 0.10 | 2.0 | 2930 |
| Lower continental crust of Southern Granulite Terrane | 0.16 | 2.0 | 2930 | |
| 10 | Oceanic lower crust | 0.2 | 2.0 | 2940 |
| 11 | Lithospheric mantle | 0.02 | 3.4 | 3200 ( 1 + 4.5 x 10.59(1300-) ) |
| Title | Evolution of Sutures/Shallow Mantle Boundaries |
|---|---|
| Participants | S. Das Sharma, D. S. Ramesh, P. A. Raju and C. Bapanayya |
| Sponsoring Agency |
Work Description:
Geophysical signatures per se are of extreme value. However, their interpretation needs to be tempered with relevant geological, geochemical and geochronological results in order to reduce the ambiguity associated with their evolution. We present some important results that emerged from this research project, besides a significant study on climate variability during the Marine Isotope Stage 11, popularly known as MIS 11 that spans 368-552 kyr time intervals.
(i) Imaging mantle lithosphere for diamond prospecting in southeast India- Confirmation of a thick lithosphere from seismological data and xenolith modeling
This study focuses on a wide area in southeast India, parts of which are bestowed with both diamondiferous and non-diamondiferous kimberlite/lamproite occurrences. Using Ps (SV and SH) and Sp receiver function techniques, we recover depth images of the lithospheric mantle beneath southeast India encompassing the Eastern Dharwar-Bastar cratons and the adjoining Eastern Ghats Mobile belt. These images reveal presence of two significant velocity anomalies of contrasting nature at different depths beneath the study region. High velocity features are observed between 160 and 220 km depth (Lehmann discontinuity depth or L-depth) while a complex low velocity contrast layer (LVZ) is delineated at ~ 80-100 km depth. Analyses of results from several other studies that include regional geology, geophysics, geochemistry, and geochronology allow us to infer that the positive velocity contrasts at L-depth represent preserved oceanic remnants of a ~1.6 Ga old paleosubduction event in southeast India. Computations on selected geothermobarometry data in conjunction with multiple evidences presented in this study argue that the craton beneath southeast India is underlain by a thick lithospheric root/keel in excess of 200 km. This suggests an environment conducive for diamond stability. Consequently, the delineated complex LVZ feature is favored as a mid-lithospheric discontinuity (MLD) and not the shallow lithosphere-asthenosphere boundary (LAB) as inferred earlier in the study region. Our transverse component receiver functions bear remarkable similarity in shallow mantle stratification with that of the kimberlite bearing Slave craton in Canada (Fig.43.1) that has confirmed presence of diamonds accompanied by a thick lithospheric keel.
The results obtained from this study together with several other lines of evidences discussed above collectively reaffirm that the shield areas/cratons beneath southeast India have deep keels associated with low geothermal gradient which are indeed the potential regions where the diamond crystals remain stable (Fig. 43.2a and43.2 b). Diamond potential of SE India is discussed in light of a working model that incorporates the Mesoproterozoic paleosubduction scenario (~1.6 Ma event) and subsequent kimberlite/lamproite intrusions (Fig. 43.2b).
Wide regions covering the Godavari graben and adjoining areas besides a few others are identified as potential zones for diamond exploration endeavors (Fig.43.2c). Initiation of concerted efforts in these regions might prove extremely rewarding. Such a P-T environment is referred in the literature as the diamond 'storage area'. In summary, it is encouraging that the three regions (I-III) demarcated within the Bastar and Eastern Dharwar cratons in our study (Fig. 43.2c) are laden with a vast hidden potential for more future discoveries of kimberlite/ lamproite intrusions. Search for new indicator minerals that are stable within the stability field of diamond and dominantly defined by subduction related process that possibly operated over an area in excess of 2 ×p 105 km2 holds the key to realize the unrealized potential of the study region in terms of diamond exploration.
(ii) Addressing evolution of sutures in the southern granulite province of India
The large volumes of diverse data generated on the southern granulite province (SGP) of India using various specialized tools, despite their inherent advantages, apparently failed to forge unity in terms of convergence of their interpretation to evolve a robust model for the evolution of this region. One important contributing factor to this predicament can be traced to the serious gaps in our understanding of the status of shear zones in the region. Interpretations based on surface geological features alone can be misleading and results that hinge on geochronology and geochemical techniques often remain inconclusive especially in a region like the SGP which witnessed multiple metamorphic events with obvious overprinting. Expectedly therefore, two fundamentally diverse hypotheses, advocating the models of collision and non-collision became popular and are proposed by different researchers for the SGP. One of these two models could assume the status of a preferred model only after verification through properly designed experiments that can accrue both areal and depth related information. Based on a critical overview of the earlier researches, the crucial gaps in our existing knowledge on the SGP are identified. This is followed by the rationale to design new broadband seismological experiment to image the deeper domains of the critical segments of the SGP through judicious/optimal seismic station positioning poised to provide new subsurface information in an unprecedented manner. Such an initiative is expected to yield an unambiguous, comprehensive and mutually consistent model that is capable of explaining results obtained from diverse specialized tools. In the global context, the seismic images of southern granulite province are extremely important as these would provide better constraints on our understanding of the evolution of East Gondwana.Data acquisition towards this study is in progress.
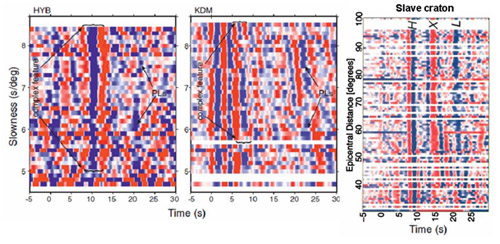
Fig.43.1:
Transverse (SH) receiver function stacks at station HYB and KDM. Presence of anisotropic and/or dipping layers beneath a seismic station is usually broadly reflected as back-azimuth dependence of the Ps converted observed on the radial (SV) component.
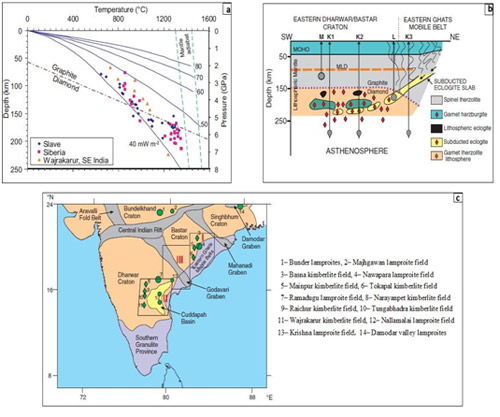
Fig. 43.2 :
(a) P-T estimates on xenoliths from a few locations within the study area. Similar data on mantle xenoliths of the Archean Slave and Siberian cratons are also plotted in this figure for comparison. It can be seen that the P-T data estimated from the xenolith compositions corresponding to all the three cratons define geotherms that intersect the mantle adiabat at depths in excess of 200 km. Blue curves represent conductive geotherms inferred from surface heat flow starting from 40 mW m-2 are shown in steps of 10 mW m-2 increment. The regions bounded by green lines indicate the range of mantle adiabats. The graphite-diamond phase boundary is also shown. (
b)Cartoon depicting processes and environment congenial fordiamond genesis. Schematic shows crosssection of Archean Eastern Dharwar craton and Proterozoic EasternGhats mobile belt and the presence of receiver function–delineated midlithosphericdiscontinuity (MLD) at ~80 km depth and Lehmann depth(L-depth) features (relict subducted slab) at depths between 160 and 220km preserved to date. This suggests that a thick lithospheric keel underliessoutheast India, favoring formation of diamonds and their residencewithin the lithosphere of the study region. Several possible diamondsources are presented in the cartoon. These can originate in a heterogeneous lithospheric mantle and/or in a more homogeneous asthenospheric mantle and could be sampled by kimberlites or lamproites. Such processes are depicted schematically. L—lamproite; M—melilitic magma; K—kimberlite.
(c) Distribution of diamond-bearing source rocks (kimberlites and lamproites) shown in the cratonic map of southern India. A total of fourteen occurrences distributed over the four cartons, viz., the Bundelkhand, Singhbhum, Bastar and Dharwar cratons are shown. Green diamonds and circles shown in the figure refer to kimberlite and lamproite occurrences respectively. Our study yields depth lithospheric images pertaining to three regions demarcated as I, II and III. Note that while most of the kimberlite and lamproite occurrences identified till date fall within regions I and II, a large area exists (region-III) devoid of such reports and needs exploration.
| Title | Sea surface temperatures in cooler climate stages bear more similarity with atmospheric CO2 forcing |
|---|
Work Description:
The interglacial Marine Isotope Stage (MIS) 11 received special attention due to its remarkable resemblance with present-day climate. Based on synchronicity of marine, ice-sheet and terrestrial proxy responses, warm episodes with intervening cool phase(s) at MIS 11 are qualitatively established. We quantitatively evaluated 15 climate proxies during 368-552 kyr intervals adopting novel long-range cross-correlation approach and information-theory based similarity measures. We also estimate the information flow rate and dominant flow direction between these climate variables using transfer entropy and the related directionality index (Fig44.a). Our results unequivocally establish that atmospheric CO2 (pCO2) is the driving signal while all other proxies used in this study are the responses. The climate forcing greenhouse gas, the atmospheric CO2 (pCO2) and the response signals like sea surface temperature (SST) and carbon isotope composition of total organic carbon (δ13CTOC) proxies are strongly correlated (~1 or – 1) without significant observable time lag (less than 1 kyr). Various substages of MIS 11 are recognizable in the SST data alone based on normalized similarity measures. Additionally, 8 more proxies from lacustrine sediments are identified as primary. During the cooler substages, these proxies bear more similarity with ambient atmospheric pCO2. Thus, the information theory-based similarity measures suggest that atmospheric CO2 fluctuations are best captured by at least 9 climate proxies during cooler interglacial events (Fig. 44.b). Based on the results related to interglacial MIS 11 and 13 obtained in this study, an important implication relevant to anthropogenic CO2 input to the present day atmosphere can be distilled. It is that, sensitive and better coupled response proxies such as SST and MAT which already show an increasing trend are likely to behave in a more dissimilar manner in future. That is, they tend to behave more independently in the near future (~0.75 kyr).
Further, presence of significant energy in the transverse (SH) component corresponding to such identified Ps converted phases on the radial (SV) component becomes diagnostic of presence of a dipping/anisotropic layer beneath a seismic station. Prominent arrivals on the transverse component (SH) receiver functions corresponding to the PLs (centered on 20 s in the SV component) and a complex phase with positive-negative-positive peaks corresponding to ~10 s are seen. These energetic features on the SH component authenticate the claims of possible presence of the dipping interfaces beneath both the stations. The complex signal at ~10 s on the SH component was also documented by previous researchers beneath station HYB. However, they discuss this feature only as a negative phase possibly arising from an anisotropic and/or dipping layer at ~ 90 km depth. Based on the results obtained from both Ps and Sp receiver functions in addition to various other studies, we attribute the origin of this complex feature to a pervasive mantle metasomatic process during kimberlite intrusions in the geologic past. Similar complex features around 10 s and other shallow mantle features beneath the kimberlite-bearing Slave craton of Canada are shown for comparison.
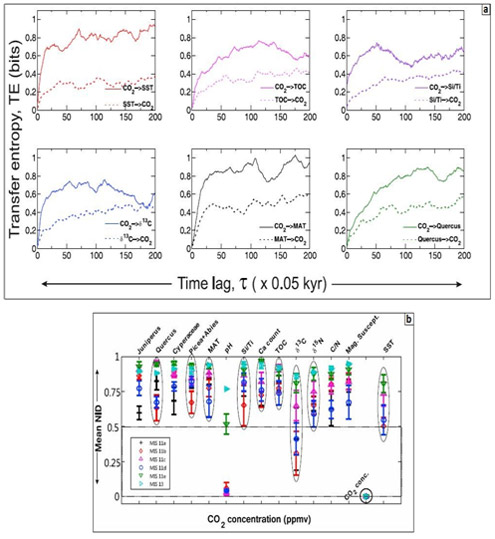
Figure 44. (a) Transfer entropy between atmospheric CO2 concentration and six other selected climate proxies as a function of time lag, t. The flow of entropy (information) from atmospheric CO2 concentration to all proxies (though six are shown here) is significantly higher (solid lines) compared to the reverse flow direction (broken lines). Therefore the net information flow is positive. The net positive flow of information from CO2 concentration implies that this parameter is the driving force and other climate variables act in response. A rapid rate of entropy transfer, within the first 15 lags (~0.75 kyr), is associated with the response proxies such as SST, δ13 CTOC, TOC and MAT. This indicates that these response proxies are most sensitive and are influenced instantaneously due to changes in atmospheric CO2 concentration. The remaining two proxies show a delayed response.
(b) Information theoretic measure of similarity, the Normalized Information Dimension (NID) for all climate proxies with reference to atmospheric CO2. NID is a metricized distance measure that ranges between two extreme values, 0 (maximum similarity) and 1 (no similarity), to quantify the amount of deviation/divergence. Two interglacial Marine Isotope Stages MIS 11 and MIS 13 are considered for the analyses. NID values of all 15 climate proxies are computed at resolutions of 0.01 kyr and 0.05 kyr for each MIS stage/substage. A 20 point moving average is used to impart stationarity to the data. Mean NID for each pair of variables is obtained applying a bootstrap method with 500 realizations obtained at these two resolutions. The standard deviation is shown by error bars. It is remarkable to note that the cool (MIS 11b and 11d) and warm (MIS 11a, 11c and 11e; MIS 13) stage/substages show up as distinct clusters in NID measurement. While transiting from cooler to warmer episodes the NID values for nine proxies follow an ascending order showing segregation. These nine are classified as primary climate proxies as they inherit concomitant changes to climate forcing and their NID values are marked within ellipses.
| Title | Meteorite impact cratering processes on Earth and other planets |
|---|---|
| Participants | P. Senthil Kumar, R. Menon, K, J. Prasanna Lakshmi, N. Krishna, A. S. Kumar, V. Keerthi |
| Sponsoring Agency | CSIR-NGRI |
Work Description:
[1] Impact fragmentation of basalt at Lonar crater
Impact fragmentation is a fundamental geologic process that affected all planetary bodies. Basalt is common on the surfaces of terrestrial planets and is extensively damaged by meteorite bombardment. Lonar crater is a unique basaltic impact structure on Earth that preserves the fragmental ejecta around the 1.8 km diameter crater (Figure 45.1). To understand the process of impact fragmentation in the basaltic target, we characterized the ejecta fragments and the crater interior of Lonar crater and compared with the data from other planetary bodies. Upper surface of the Lonar ejecta is largely made up of sand-pebble size particles, which are underlain by cobble-size angular fragments. Decimetre to meter size angular boulders are abundant near the crater rim, while they are scattered elsewhere in the ejecta. Based on several hundreds of size measurements in the field, cumulative size-frequency distribution of pebble to cobble size fragments define an average power-index (b value) of -2.5, while it is higher (-3.4) in the boulder size ejecta. These results are comparable to the cumulative size-frequency distribution of the near-earth asteroid Itokawa. On the other hand, the Lonar fragments have lower power indices than the impact and volcanoclastic fragments on the Moon (-4.5 and -4.2, respectively). The differences in the power-indices within the Lonar ejecta and between planetary objects should indicate the complexity in the impact fragmentation processes. The cumulative mass-frequency distribution of the Lonar ejecta confirms the complexity in terms of single or multiple fragmentation events. Our field observations in the proximal ejecta of Lonar clearly point to multiple collisions between the basaltic fragments during the ejecta emplacement, which reflect in the power index values. Shape of the Lonar fragments were also defined based on 1300 measurements of principal axes. They are mostly compact, platy, bladed and elongated shapes or a complex combination of these forms. Interestingly, the shapes of Lonar fragments are similar to those of experimental impact fragments and Itokawa, but are different from the lunar fragments. Several hundreds of edge angles were measured on the Lonar fragments, they provide an average value of 100 degrees, which are again similar to those measured on asteroid surfaces. To understand the provenance of cobble-boulder size ejecta, we made more than 2400 fracture spacing measurements throughout the upper crater wall. The cumulative fracture-spacing frequency distribution of the upper crater wall (power index = -3.3) is dramatically similar to the gravel size ejecta fragments (power index = -3.4) (Figure 45.2). This confirms that most of the decimeter to meter size fragments were originated from the upper interior wall, where a thick massive basaltic lava flow is exposed. In addition, we carried out laboratory reflectance spectroscopic measurements of both fine ejecta fractions and the bedrock samples from the crater interior in the wavelength range of 400-2500 nm. The fine ejecta is characterized by the spectral absorption features indicative of abundant Fe-Mg rich phyllosilicates (clays), which are largely found as layers of redbole in the upper to middle crater wall. The spectral similarity between the fine ejecta and the redbole layers clearly show that the cratering event excavated the phyllosilicate layers beneath the massive basaltic flow in the upper wall. A large number of impact craters on the Mars contain phyllosilicate-rich ejecta that were originated from the subsurface phyllosilicate-rich layers. We obtained shear wave velocity images of the Lonar ejecta using multi-channel analysis of surface waves, which revealed the spatial variation of ejecta thickness and zones of concentration of cobble-boulder size fragments within the ejecta. Density, P and S wave velocity and uni-axial compressive strength of the ejecta fragments were also measured. This petrophysical data are useful in the numerical modelling of the impact event at Lonar.
[2] Origin of boulders on the Moon by impact processes:
Boulders are ubiquitous on the surface of Moon, as they were produced by impact cratering processes. It is well known that these boulders range in size from a few meters to several tens of meters. The size of boulders decreases from the crater rim to large distances, as a function of an increase in the ejection velocities. The boulders are also responsible for the formation of secondary impact craters on the Moon. Here, we investigate the nature of boulders in and around an impact crater (400 m diameter) in Oceanus Procellarum. It is a fresh crater with well developed ejecta and rays. Using Lunar Reconnaissance Orbiter Narrow Angle Camera image, we mapped the boulders around the crater using ArcGIS mapping tool (Figure 45.3). About 2227 boulders were mapped. Size of these boulders varies from 1.25 m to 13 m. A maximum range of the boulders from the crater center is ~870 m. Axial ratio of the boulders is found to vary from 0.3 to 0.9 with a majority around 0.7. The cumulative size frequency distribution of these boulders define a power index -4.54 in the diameter range of 3-11 m. The power index is very high compared to those in the ejecta blanket of Lonar crater, which is a terrestrial impact crater. We suggest that the steep power-law slope of the lunar boulders is due to multiple fragmentation in the lunar regolith. Our interpretation is consistent with our geological observations from the crater interior that exposes a thick fragmental layer. The similarity between the boulders in the fragmental layer and those on the ejecta further supports this hypothesis. The presence of a central mound on the crater floor and the V-shaped ridges emanating from the eastern crater rim indicate that it is a oblique secondary impact crater of Copernicus.
[3] Geological mapping of the Lada Terra quadrangle(V-56), Venus
Geological mapping of Venus has been undertaken at a wide variety of scales and by a large number of individuals, including broad terrain maps derived from Earth-based radar images, classifications and geo¬logic mapping based on Pioneer-Venus topography and imaging, comprehensive geological mapping based on the northern area covered by Venera-15/16 radar and altimetry data, specific thematic areas using all available data sets, generalized global terrain maps 2 compiled using Magellan data, and specific areas (quadrangles) mapped at specific scales. An example of the latter is the currently ongoing NASA program administered by the U.S. Geological Survey that involves many individual geologists and their co-workers. These NASA/USGS mapping efforts have resulted in publica¬tion of more than half of 62 1:5,000,000-scale quadrangles that cover about 45 percent of the surface of Venus. These maps provide valuable documentation of the local to regional geologi¬cal settings and processes. In this regard, a geological map of Lada Terra quadrangle (V–56), a portion of the southern hemisphere of Venus that extends from lat 50° S to 70° S and from long 0° E to 60° E, has been prepared and is currently in production (SIM 3249) in the USGS. The geological map of V–56 quadrangle reveals evidence for tectonic, volcanic, and impact processes in Lada Terra in the form of tesserae, regional extensional belts, coronae, and volcanic plains. In addition, the map also shows relative age relations such as overlapping or cross-cutting relations between the mapped geologic units. The geology observed within this quadrangle addresses (1) how coronae evolved in association with regional extensional belts and (2) how tesserae, regional plains, and impact craters, which are also significant geological units observed in Lada Terra quadrangle, were formed.
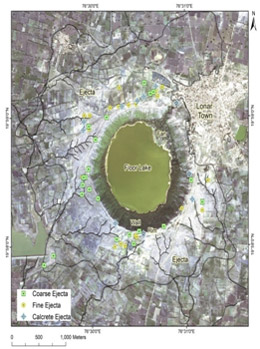
Fig.45.1:
QuickBird image showing Lonar crater and distribution of sample locations.
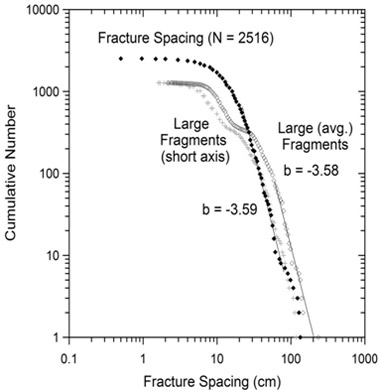
Fig. 45.2 :
A comparison of fragment size distribution of Lonar crater ejecta with the fracture spacing distribution in the upper crater wall.
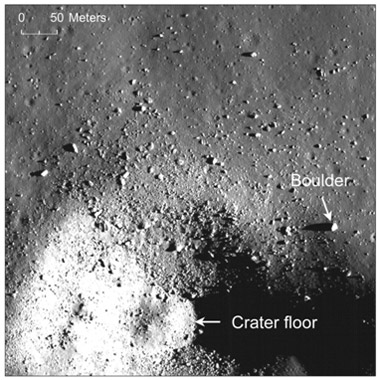
Fig. 45.3 :
A 400 m diameter lunar crater showing the distribution of boulders in and around the crater.
| Title | Landscape evolution and its response to paleoclimates in parts of the Indian Shield and North Eastern Himalayas using Low temperature thermochronology (WP 3.5) |
|---|---|
| Participants | Devender Kumar, D.V. Reddy, B. Kiran Kumar |
| Sponsoring Agency | CSIR-NGRI (12th Five Year Plan Project) |
Work Description:
The proxies of past climatic changes are invariably preserved in the sediments of various geomorphic features along the eastern coastal regions of India. The earlier studies in the deltaic regions of Krishna and Godavari rivers (Fig. 46.1) have reported the style of delta progradation towards sea in three stages and observed strand lines (SLs) running almost parallel to the present coast line. During first phase of our field work, traverses have been taken across these SLs in the study region (Fig.46. 1) to locate the suitable sites for making trenches. Out of the total 11 trenches (depth ranging from 1 to 2.3 m) made, stratigraphic observations show that 7 trenches at sites located in the East Godavari, West Godavari and Krishna districts of Andhra Pradesh (India) were suitable for sediment sampling. The samples for optically stimulated luminescence (OSL) dating were collected in depth profiles (Fig.46. 2) at each site. Lab processing of samples is in progress. The OSL ages are likely to constrain formation timings of these SLs and provide insights on phases of climatic changes recorded therein.
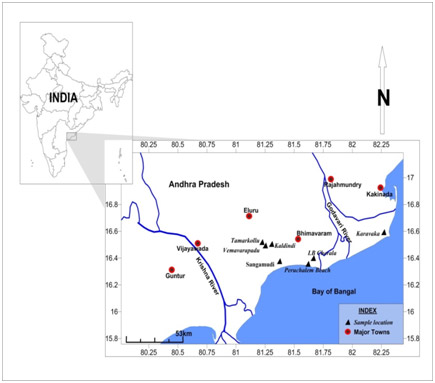
Fig.46.1:
The study area and trench site locations
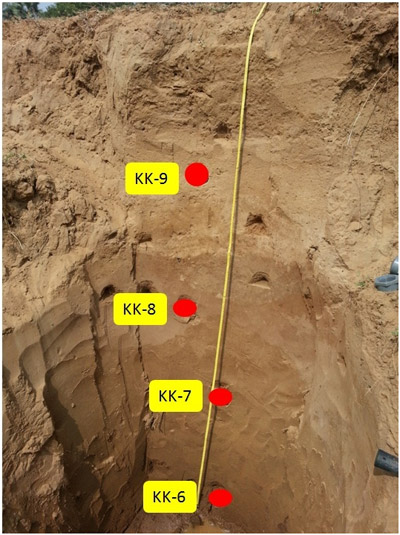
Fig. 46.2 :
A typical trench (2.3 m deep) dug up for sediment sampling in depth profile at a representative location Kaldindi in Krishna district. The depositional strata (from top to bottom of trench) comprises fine, fine to medium grain sand with various colours and indications of bioturbation at places.
| Title | Modeling of Earth’s convective interior with implications for geomagnetic field generation |
|---|---|
| Participants | A. Manglik, M. Suresh, P. Mallika |
| Sponsoring Agency | CSIR-12FYP |
Work Description:
Dynamical boundary condition for local variations in the inner core growth:
Thermal and compositional buoyancy forces drive convection in earth’s fluid core. The heat flux coming out of the core also varies laterally, having implications for non-uniform growth of the inner core and magnetic field generation through a dynamo mechanism. In the presence of non-uniform growth, widely used boundary conditions of fixed flux or fixed temperature over the entire surface of the inner core boundary (ICB) are gross simplifications. We have derived a dynamical boundary condition linking the local heat flux gradient to the secular cooling at ICB and further linking heat flux with the compositional flux at ICB. This formulation takes into consideration the local variations in the vigor of convection and hence the local growth rate of the inner core. We have implemented this new boundary condition in our double-diffusive MHD code relating the thermal flux to the secular cooling at ICB through a new control parameter, estimated various thermal and compositional energy fluxes because of the growth of the inner core and carried out more diagnostic computations. In this approach, the flux of light density elements and latent heat from the inner core directly depend on the local inner core growth. Preliminary results show that the vigor of convection is intermediate between the two extreme cases of the fixed flux and fixed temperature at ICB for moderate values of the new control parameter.
[A. Manglik, J. Wicht*, U.R. Christensen*]
* Foreign collaborators: Max-Planck Institute for Solar System Research, Germany
Transverse tectonics in the Sikkim Himalaya:
The tectonics of seismically active Sikkim Himalaya, as inferred by numerous seismological studies, is distinct from the conventional thrust tectonics proposed for the Himalayan collision belt. Here, focal mechanisms of several moderate magnitude earthquakes and composite fault plane solutions of micro earthquakes have revealed strike-slip motion along faults transverse to the northward convergence direction of the Indian plate. We have analyzed broadband magneto telluric data of 12 sites located along an approximately N-S profile cutting across major geological sub-domains of Sikkim to test whether magneto telluric strikes also support such transverse tectonic nature of the region. We have performed strike analysis of the data by LaTorraca (LT) and Groom-Bailey (GB) decomposition approaches as well as by phase tensor (PT) method. The results by GB and PT approach are shown in Fig.47.1. The study has revealed local variations in the strike directions within the region consistent with the geological and tectonic setup and the presence of transverse tectonic features in the region of Main Central Thrust Zone (MCTZ) where major axis of phase ellipses align in NNW-SSE to NW-SE direction. This trend coincides with the one obtained by microseismic data recorded after the September 18, 2011 earthquake (Mw 6.9). Magnetotelluric strike analysis thus supports the presence of NNW-to-NW trending transverse tectonic zone in MCTZ.
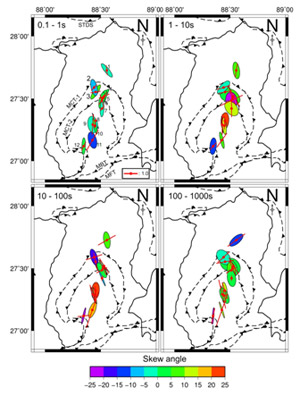
Fig.47.1:
Strike directions at various sites for four different period bands obtained by GB (bars) and PT (ellipses) approaches. Bar lengths are scaled to 1/sqrt(RMS Error). Large bars indicate good fit. PT ellipses are also normalized so that major axes at all sites are of the same length.
[A. Manglik, G. Pavan Kumar, S. Thiagarajan]
Current channeling in MCTZ:
We have obtained some interesting features of the MT data of the Sikkim Himlaya. The broadband MT data of the site (FB) at the northern boundary of the zone reveals anomalous phase exceeding 90o for frequencies smaller than 1 Hz whereas other sites further north (LZ) of this zone show normal behavior. Such anomalous phase behaviors are difficult to be explained by simple 2D models because these phase distortions might arise due to the current channeling in the presence of localized 3D conductors or due to subsurface structure consisting of anisotropic blocks/layers having special configuration of anisotropy strike directions and anisotropy ratio. The presence of current channeling can be identified through the estimation of relative strength of horizontal magnetic fields from synchronous time series data of neighboring sites. Horizontal magnetic fields are enhanced over the conducting channel and their phase relationship can give clues on the orientation of the channeled as well as regional induced currents, which form the source of channeled currents. We have synchronous time series of 4 days duration in the frequency band of 0.01–1 Hz (LF3 band as defined in Mapros) for the sites LZ and FB of which we have extracted good quality time series of 18 h duration and computed stacked spectra using window length of 4096 samples. The strength of the horizontal magnetic field at FB is enhanced by an order of magnitude around 2s period (Fig. 47.2a) indicating the presence of current channeling at FB. It gradually decreases to almost normal values at 100s period. The dominant direction of the horizontal field at LZ is N30°E whereas it is aligned in the north direction at FB. Fig. 47.2b shows the current channeling direction at FB with respect to LZ. We have also computed the ratio of the vertical to the horizontal magnetic field at both sites (Fig. 47.2c). The vertical field at LZ is negligible compared to the horizontal field indicating the 2D nature of the subsurface. Site FB shows strong localized perturbations as revealed by the enhancement in the vertical field. These results support the presence of localized channeling effect at FB.
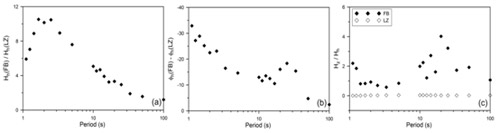
Fig. 47.2 :
(a) Enhancement in the strength of the horizontal component of magnetic field (Hh) at FB compared to the field at LZ, (b) change in the azimuth of Hh at FB with respect to that at LZ, and (c) ratio of vertical field to Hh at both sites.
[A. Manglik, G. Pavan Kumar]
| Title | Magnetotelluric investigations in Sikkim |
|---|---|
| Participants | Prasanta K. Patro, K. Chinna Reddy, Narendra Babu and K. Shankaraiah |
| Sponsoring Agency | MoES |
Work Description:
Sikkim region falls between Main Boundary Thrust (MBT) and Main Central Thrust (MCT). In 1988, Sikkim witnessed magnitude of 6.6 earthquake. It is believed that the seismic activity is confined to the MBT and MCT in the Sikkim Himalaya. With an aim to understand the electrical signatures of the thrust zones such as Main Frontal Thrust, MBT and MCT, NGRI acquired 18 broad-band (0.001 to 1000s) magnetotelluric stations in 2005, (Patro and Harinarayana, 2009) from Siliguri (in the south) to Yumthang (in the north).
In 2006, Sikkim region is struck with another moderate earthquake of magnitude 5.3.In order to understand the conductivity changes associated with the earthquake, MT data was acquired at 20 MT (0.001 to 1000 s) and 6 LMT (100 to 12000 s) locations during Sep, 2011 to Dec, 2011 field season (Fig 48.1). At each station, broad band data was acquired for 3 days. LMT data was acquired for 8 to 11 days. Remote reference recording was carried during the data acquisition. One of the main objectives of the study was to re-occupy old stations using same kind of instruments for same frequency range. We could successfully reoccupy some of the old stations while we could not re-occupy a few stations due to growing civilization (see Fig 48.2) and/or damage/closure of roads due to 18th September 9 Mw earthquake.The preliminary data analysis results are presented in the fig 3 at a site ‘ran’. In this figure, for a comparison the MT transfer function computed during 2005 is also presented.(Fig 48.3)
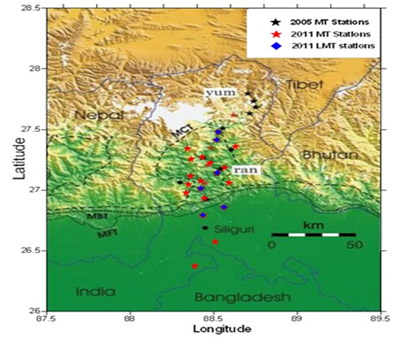
Fig.48.1:
Location map of MT and LMT stations in Sikkim Himalayan region, India.
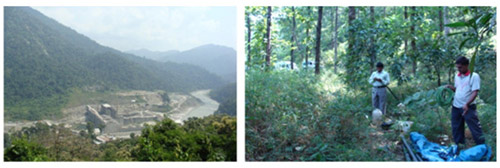
Fig. 48.2 :
Pictures to the left shows the old site now turned to a hydro power project. The picture to the right is a site in the road side jungle.
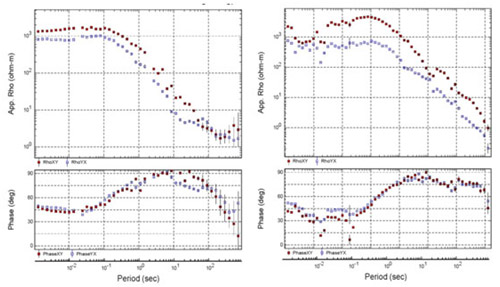
Fig. 48.3 :
MT transfer functions at a site ‘ran’ before (left) and after (right) the earthquake.
| Title | New occurrence of a rare Troctolite intrusion from Lailunga layered Mafic-Ultramafic complex, eastern part of Central Indian Tectonic Zone, Central India |
|---|---|
| Participants | D.V.Subba Rao, Kundan Banzare+, S.L.Ramesh, M.Sathyanarayanan, A.Keshavakrishna and (+ Directorate of Geology and Mining (D G M), Bilaspur, Chhattisgarh) |
| Sponsoring Agency | CSIR-NGRI |
Work Description:
The Precambrian volcano-sedimentary supracrustal rocks of Lailunga area occurring in the eastern edge of the CITZ, central India, are intruded by multiple phases of different ultamafic-mafic and felsic rocks. The Lailunga layered complex is represented by ultramafic-mafic intrusions (Metapyroxenites/hornblendites and leuco-mafic gabbros with sulphide rich zones). The synplutonic intrusions of granodiorite and granites emplaced into the gabbros has resulted in extensive magma mixing and magma mingling zones along their contacts. In this Lailunga complex, a rare melanocratic-leucocratic troctolite intrusion is reported for the first time and is well exposed in the central part of the layered complex. The troctolite body shows N700E trend and is surrounded by leuco gabbro and mafic gabbros on either sides of the intrusion.
The troctolite is a medium grained rock and consists of mainly 30-45 modal percent cumulus olivine and 40-50 modal percent cumulus plagioclase 5-10 mm in length. The plagioclase laths are randomly oriented and are often enclosed by olivine. Oikocryst augite is common. Magnetite occurs as intercumulus mineral associated with Ilmenite. Disseminations of sulphides are conspicuous throughout the rock. Olivine crystals contain minor to significant amounts of sulphide and show no significant trends in the plot of Ni versus Fo content, (in olivines) with varying Ni and Fo Contents.
The major element compositions of intrusive rocks are controlled essentially by the proportion of cumulus plagioclase, olivine and trapped silicate liquid (Li etal. 2000). Most of the troctolite samples fall within or close to the olivine-plagioclase composition array. MgO varies from 16.69 Wt% to 23.9 Wt% and have high Cr (592 ppm) and Ni (309 ppm) contents. They show tholeiitic/iron enrichment trends in the AFM plot. In the MgO vs. Al2O3 and CaO variation plots, these rocks show decreasing Al2O3 and CaO with increasing MgO indicting olivine and pyroxene fractionation within the suite. REE patterns of troctolites show highly fractionated patterns (La/YbN = 3.1-5.5) with strong LREE enrichment (La/SmN = 1.5 to 2.4), absence of Eu anomaly, and sloping HREE or depleted HREE patterns suggesting their derivation from deeper upper mantle with minor garnet involvement in residue (Fig53.1a). In the primitive mantle normalized spidergram plots (Li etal. 2000), the troctolite samples show strong enrichment in some of the LILE (Cs, Ba, Pb and K), slight Th and U enrichment, and a slightly negative Ta+Nb anomaly. The elevated Sr and Eu concentrations reflect the modal plagioclase content., likewise Ti present in oxide minerals (Il & TiMt) and P is present in apatite (Fig.53.1b). The absolute abundances of trace elements are controlled by the amount of trapped liquid. PGE patterns of these troctolites are characterized by IPGE depletion and PPGE enrichment with a positive Rh anomaly. The PGE concentrations are distinctly low in comparison with data from many other Ni-Cu magmatic sulphide deposits of the world.
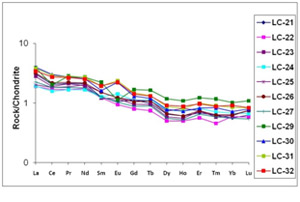
Fig.53.1a:
Chondrite normalised REE distribution patterns of the troctolites from Lailunga mafic-ultramafic complex, Chattisgarh, Central India
Fig.53.1b:
Primitive Mantle normalised spidergram plot of Lailunga troctolites.
| Title | Geochemical Investigations in the Proterozoic volcanic formations of Dongargarh Supergroup, Bastar Craton, Central India |
|---|---|
| Participants | Tarun C. Khanna, D.V. Subba Rao and A. Keshav Krishna |
| Sponsoring Agency | CSIR-NGRI |
Work Description:
Dongargarh Supergroup is ~90 km wide and ~250 km long NNE-SSW trending, Paleo-proterozoic volcano-sedimentary succession masked by the dense forest cover, that is situated in the Bastar craton in Central India (Fig. 49.1 showing the sampled locations (•); modified after Geological Survey of India quadrangle 64C, 2006). The Dongargarh Supergroup consists into two well established unconformable stratigraphic groups: Paleo-proterozoic Nandgaon Group and Paleo-to Meso-proterozoic Khairagarh Group. Each group is further classified into distinct bimodal volcanic horizons. Nandgaon group consists of Bijli rhyolites and Pitapani volcanics. A conglomerate / sandstone horizon, unconformably overlying the Pitapani volcanics, represents the basal part of the Khairagarh Group. The Khairagarh group consists of Sitagota, Mangikhuta and Kotima volcanic formations that are alternatively interspersed with Karutola orthoquartzites and Ghogra sandstone and shales, respectively. The regional tectonic framework and stratigraphic positioning of the Dongargarh volcano-sedimentary succession suggests a protracted period of episodic magmatic activity with interludes of marine transgression/regression events that collectively occupy a considerable duration of the Proterozoic time span.
The long standing debate: whether the Dongargarh Supergroup has evolved in a rifted intra-continental setting, or is it a consequence of arc magmatic processes at convergent margin, was not fully understood. Hitherto, ambiguity prevailed over the past few decades with regard to the origin and nature of magmatism and the geodynamic setting of the Dongargarh Supergroup. Therefore, in an attempt to provide additional constraints for a better understanding and resolve some of these impending key issues, we focus on the petrogenetic aspects of the lithologies from the four volcanic formations in the Dongargarh Supergroup. For this purpose, ~ 108 volcanic rock samples were collected from all the four formations i.e., Pitapani Fm., Sitagota Fm., Mangikhuta Fm. and Kotima Fm. amongst which a representative subset consisting of ~ 72 volcanic rock samples were then selected for further detailed petrology and geochemical investigations.
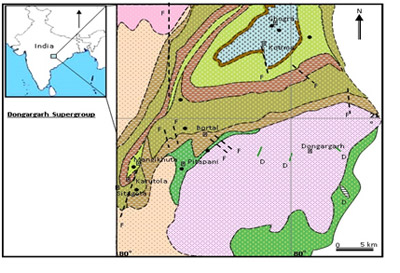
Fig.49.1:
Geological Map of Dongargarh Supergroup
| Levels of Impurities (ug/g) in Different Grades of Argon2 | ||||
|---|---|---|---|---|
| Inpurtiy | XL Argon ( 99.0003% ) | Argon Iolar I | Argon Iolar II | Argon Standard |
| O2 | 1.5 | 2 | 4 | 5 |
| H2O | 1 | 2 | 4 | 5 |
| Total Hydro Carbon (THC) | 0.2 | 0.2 | 0.5 | 0.5 |
| CO | 0.2 | a | 0.5 | 0.5 |
| CO2 | 0.5 | a | 0.5 | 0.5 |
| N2 | 2 | 3 | 10 | 20 |
| H2 | a | a | 2 | 2 |
| N2O | 0.5 | 1 | ||
| a From BOC India, Ltd., Hyderabad: Data for welding grade argon is not available | ||||
| Various Isotopes of Xenon, Their Abundances and possible Interferences of Polyatomic Icons in ICP - MS Mesasurements | |||
|---|---|---|---|
| Isotope | Abundance | Interferences ( May and Wiedmeyer, 1998, Ref. 18) | Remarks |
| 124Xe | 0.096% | 124Te, 108Pd16O+ |
Most Ideally Suited, No Isobaric Overlap Next Most ideally suited, No Isobaric Overlap |
| 126Xe | 0.090% | 126Te, 110Pd16O+ | |
| 128Xe | 1.919% | 128Te, 96Ru16O+2 | |
| 129Xe | 26.44% | 113Cd16O 113In16O | |
| 130Xe | 4.08% | 130Te, 98Ru16O+2 | |
| 131Xe | 21.18% | 113Sn16O | |
| 132Xe | 26.89% | 116Sn16O, 132Ba | |
| 134Xe | 10.44% | 1186Sn16O, 134Ba | |
| 136Xe | 8.87% | 120Sn16O, 136Ba | |
| Title | Studies on igneous activity of Mikir Hills region, Assam and comparison of geological and tectonics with Meghalaya region Northeast India. |
|---|---|
| Participants | V. Balaram, D. V. Subbarao, J. Mallikharjuna Rao, M. Venkateshwarlu |
| Sponsoring Agency | DST- New Delhi (Govt. of India) |
Work Description:
The geochemical data of mafic and ultramafic related to Samchampi alkaline complex rocks show considerable variations in their major, trace and rare earth element concentrations. All the samples are either pyroxenites or related to alkaline ultramafic variants. The SiO2 varies from 45.3 to 52.3wt%, MgO 3.6 to 7.5 wt% and iron 11.2 to 14.4 wt%. They are rich in TiO2 3.7 to 4.8wt% and K2O 0.9 to 2.2 wt%. The trace element content vary significantly in the mafic rocks as shown V (327-659 ppm), Cr (194- 404 ppm), Sr (1574- 2873 ppm), Zr (396-530 ppm) and Ba (316-1328 ppm). The U and Th are below 10 ppm and rare earth elements are highly concentrated and vary from 431 to 528 ppm. All the samples show minor negative Europium anomalies indicating the plagioclase removal from the magma and exhibit highly fractionated trends. In the Mikir Hills region diorite dykes are restricted occurrence and few samples were analysed for their major, trace and rare earth element contents. The norite dykes differ in their geochemical variations compared to the dolerites and basalts which show quartz or hypersthenes normative compositions where as others dolerite dykes show olivine or quartz normative compositions. Rare earth element content varies from 116- 291 ppm and exhibits fractionated trends and show strong negative Europium anomaly (Eu/Eu* = 0.42- 0.67). Primitive mantle normalised spidergram show enrichment of large ion lithophile elements, slightly depleted rare earth element patterns and strong negative Nb, P, Hf and Ti peaks indicating contaminated nature of these norite dykes.
A total of 49 amphibolites representing massive types, enclaves and other types were analyzed from the Mikir Hills and Meghalaya regions. They show considerable geochemical variations within the groups and also depending on the source like magmatic or sedimentary. Most of them are quartz normative and few show olivine normative character. In general SiO2 varies from 48- 62%, TiO2 0.8-3.9, Al2O3 12-16%, Total iron 9-12%, MgO 4-9%, CaO 5-9%, K2O 0.4-6.3 and trace element contents V ranges from 130-384ppm, Rb 3-350 ppm, Sr127-825 ppm and Ba 40-1935 ppm. The rare earth elements show considerable variation 127- 750 ppm and define good fractionation trends and primitive mantle normalized diagram shows Sr and Zr anomalies. For geochronology studies two intrusive granites were selected and zircon seperations were completed.
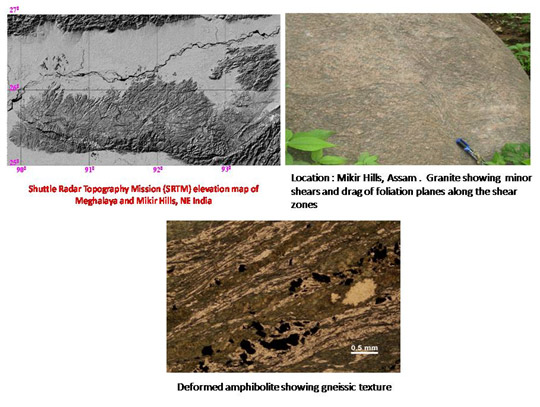
Fig.50.1:
1Studies on igneous activity of Mikir Hills region, Assam
| Title | Geochemistry of Platinum Group Element Mineralized Ultramafics of Madawara, Bundelkhand Massif, Central India |
|---|---|
| Participants | M.Satyanarayanan, S.P.Singh, V.Balaram, D.Srinivas Sarma, K.S.V.Subramanyam |
| Sponsoring Agency | CSIR-NGRI |
Work Description:
A series of lensoidal bodies of mafic-ultramafic suite of rocks trending E-W occurs as intrusions into the Bundelkhand Gneissic Complex (BnGC) in the southern part of the Bundelkhand Massif. The ultramafic rocks found are mainly dunite, spinel-bearing peridotites and pyroxenites, and are associated with talc-chlorite schists, coarse to medium diorite, quartz veins, pegmatites and dolerite dykes. The ultramafic lenses are nearly parallel to each other and are confined between the Madawara – Karitoran shear zone in the north and Sonrai –Girar shear zone in the south. The sheared relationship between ultramafics of Madawara Igneous Complex (MIC) and BnGC has been found at several places where the ultramafics are mylonitised and recrystallised and sometimes altered to serpentine-talc –chlorite schist. The following is a brief description of the different ultramafic bodies resolved spatially within the shear zone.
(a) Madawara Ultramafic Complex
The ultramafic body exposed at Madawara town is the largest among all the outcrops. This is about 3 km wide and 4-5 km in length comprising dunite, peridotite, spinel- bearing peridotite, pyroxenite, websterite are major rocks which were followed by and intrusives of gabbro and diorite in subsequent stages. They are hard and compact; dark bluish gray colored rock and is medium to coarse grained. Chrome-spinel nuggets were found as disseminated crystals in ultramafics at many places. The granular crystals of olivine, magnetite and pyroxenes are common at places. Porphyritic type texture is rare. The crystals of sulphides are visible at many places in ultramafics. The intrusive relationships of pyroxenites have been noted at several places. The signature of sulfur enriched zone in the ultramafics is mainly marked by the appearance of sulphide phases, very dark color shades and sometimes by leaching of light yellowish texture on the weathered surfaces on the peridotites. The globular segregates of ultramafics in pyroxenites (2cms to 10 cms) are common in the southern zone of Madawara ultramafics. The gabbro/diorites are found as intrusive into ultramafics in the southern part of Madawara.(Fig 51.1)
(b)Pindar Ultramafic Complex
The ultramafics at Pindar are usually medium to coarse grained that consists of peridotite, Cr- spinel bearing peridotite, harzburgite, lherzolite, dunite and pyroxenite. The olivine websterite is very dark bluish gray coloured, hard and compact, characterized by coarse grained cumulates of olivine, has been found as intrusive in the ultramafics(Fig 51.2). They occur as small to giant size lenses (upto 8-10 meter in length and 4-5 meter in width) and closed to peridotite and websterite in composition. The chilled contact of these lenses are usually crushed, altered, and some times sheared and mylonitised and rotated also. Talc-chlorite schist is seen along the sheared contact, while websterites are found as disseminated body within the ultramafics and its orientation is also parallel to the main ultramafic complex. The crenulated and fragmented nature and concretion type structure, hard and resistant to the weathering are common features that help to easily distinguish olivine websterite in the field.
Ikauna Ultramafic Complex
The Ikauna ultramafic body is ~3500 m long, 90-180 m wide, strikes 260°N and dips 50° to 70° N and is part of Madawara Igneous Complex. The chrome spinel -bearing ultramafic rock is traced to more than 1 km along the strike length. The lensoidal dark coloured pyroxenites are highly altered at their margin and sometimes crenulated/folded along the grain. The contact is partially enveloped by mylonitised chlorite (± talc) actinolite schist. The Ikauna ultramafic body is also dissected by NW- SE trending faults at several places.
Geochemical studies revealed that these ultramafic rocks are relatively enriched in Pt, Ir, Au, Ni, Cr and are depleted in Cu, Al, Ca and V. Ratios of Ni/Cu, Cu/Pd and Pd/Ir suggests late stage sulfidation prevailed over S-saturation conditions during crystallization of platinum group elements (PGE). The major element, compatible and moderately incompatible trace element and petrography data show that they have originated as residues from variable degrees of partial melting of a primitive mantle source. Based on major and trace element systematics, and published experimental melting studies, it is inferred that the peridotites represent high degree of partial melt (more than 30% melt product) by the removal of a batch melt from a primitive fertile mantle composition at pressures between 1 and 3 GPa as suggested by Walter (1999) (Geochemical Society-Special Publication, pp. 225– 240). The high Ir and low Pd/Ir ratio obtained in this study is considered as signatures for high degree of partial melting of fertile mantle at moderate to greater depth. The high degree of partial melt would promote HREE enrichment in the melt leaving a strongly LREE depleted source.
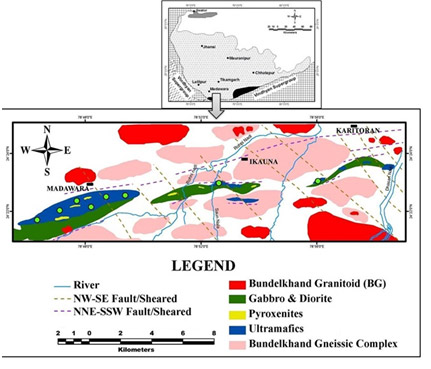
Fig.51.1:
Location and geological map of Madawara Igneous Complex, Central India showing lensoidal outcrop of ultramafic rocks as intrusions into the granite–gneisses of BnGC
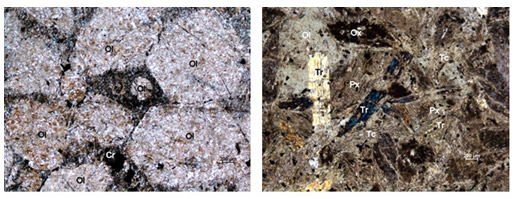
Fig.51.2:
A. Olivine cumulates in dunite from Madawara Complex. The interstitial spaces are occupied by opaques with suspected PGMs and mineral bearing metal alloys. B. Olvine websterite showing alteration. Amphiloles, talc and chlorite embedded in the matrix.
| Title | WM2.1: Active landforms evolution in Shillong Plateau to understand late Quaternary Neotectonics |
|---|---|
| Participants | Anand K Pandey (ID 994); Prabha Pandey (ID 1049) |
| Sponsoring Agency | CSIR-NGRI |
Work Description:
- The Shilong plateau is undergoing active deformation as marked by the occurrence of intra-plate great earthquake. The digital elevation model of the plateau region is generated using open source SRTM & ASTER data. The DEM is overlaid with the satellite images for mapping of active tectonic elements like tectonic lineaments, faults and landform.
- The plataeu behaves like tectonic blocks bounded by Dauki fault towards south and series of large and small lineaments within plateau are geomorphically well expressed.
- The drainage pattern in the plataeu is also controlled by active lineaments / faults.
- Efforts have been made to setup digital data processing facility and the hardware is in process of procurement.
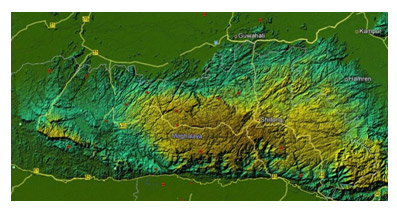
Fig.52.1:
Digital elevation model of Shilong plataeu region using SRTM data overlaid with Google images.
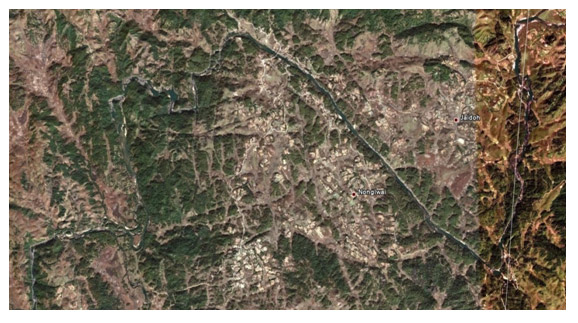
Fig.52.2:
Oblique google image showing deflection of drainage along active lineaments.