Applied Science
| Title | GROUNDWATER DATA GENERATION AT NPP SITES - SSP-563-28(RR) |
|---|---|
| Participants | R. Rangarajan, G.B.K. Shankar, Kamle Anand, D. Muralidharan, V.S. Singh, A. Mohan Reddy |
| Sponsoring Agency | BARC, Mumbai |
Work Description:
A research project study “Groundwater data generation at NPP sites” was formulated with BARC, Mumbai for generating hydro-geological data base at Tarapur Atomic Power Station (TAPS) site, near Mumbai for development of predictive surface and groundwater models at Nuclear Power Plant sites. The ultimate objective of the project is for determining the site safety and environment impact. The project entails basic groundwater data generation at the Nuclear Power Plant (NPP) site by CSIR NGRI followed by developing numerical groundwater models by BARC, Mumbai.The TAPS site (5 km2) adjacent to west coast line near Tarapur village in Palghar taluk of Thane district, Maharashtra state, receives an average annual rainfall of 1760 mm. The area is underlain by Deccan Trap Basalt formation with the thickness of about 1000 m. Groundwater occurs under water table and semi-confined conditions with the static water level vary from 1-6.5 m bgl. Hydrogeological, geophysical and tracer techniques were used at selected sites (Fig. 7.1) and in newly drilled bore holes in the study area for understanding subsurface geological characteristics, such as hydraulic conditions, rainfall recharge rates, vadoze zone parameters, aquifer characteristics, groundwater flow pattern, velocity of groundwater, chemical characteristics, radioactive contamination etc.
Fig. 7.2 shows the resistivity image at a site in the TAPS area. The figure clearly depicted a two layer geo-electrical structure representing the top soil followed by highly weathered basalts with high saturation as the first layer, extending to a depth of 5-6 m. This layer is followed by resistive layer with more than 40 Ohm-m which is the compact basalt of the flow unit. The rise of groundwater level in observation wells in the area is proportional to the quantum and intensity of rainfall events. The fast decline of water level during end of monsoon and post monsoon season indicates that the groundwater is in dynamic condition and quick outflow from the area to the seaward side as the area did not have any high groundwater withdrawal. The groundwater flow maps during monsoon based on reduced water levels of bore wells indicates, that the movement of groundwater is towards north, eastern and western side (Fig.7.3). The actual velocity (induced and natural condition) are calculated based on filtration velocity obtained through tracer technique and by taking into account the effective porosity of aquifer formations. The velocity values calculated under natural condition range from 0.53 m/d to 2.12 m/d. The velocity values calculated under induced condition range from 7.4 m/d to 38.8 m/d. Natural recharge values obtained using tritium injection technique shows that the recharge rate is 187.4 mm or 6.6 % of the effective rainfall. Lower recharge rate is mainly due to presence of shallow water table condition during the monsoon period. The analytical data of groundwater samples indicates that in most of the cases, the Total Dissolved Solids and concentrations of ions are within the permissible limit for drinking water and the dominant groundwater in the complex are CaHCO3 and Na-CaHCO3 types. The conductivity data also shows that there is no sea water intrusion to the fresh water aquifers at moderate aquifer depth level.
The saturated and unsaturated zone data generated under the project is used in development of predictive groundwater models for formulating site safety measures.
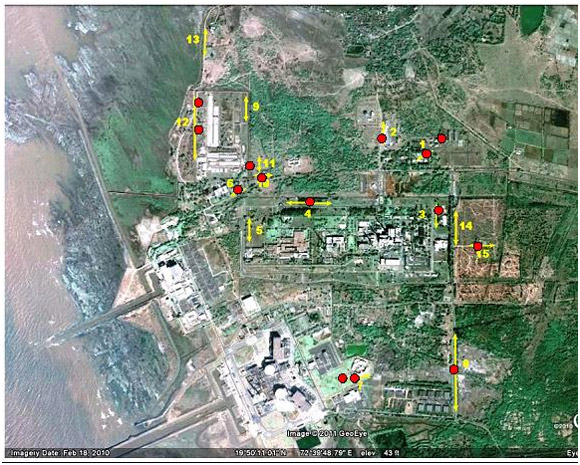
Fig.7.1:
Location map of TAPS area with experimental sites
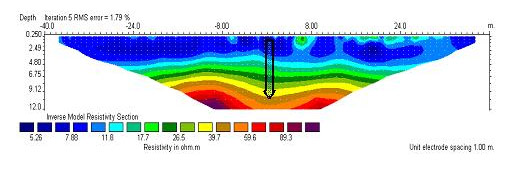
Fig.7.2:
Resistivity imaging at a site in TAPS
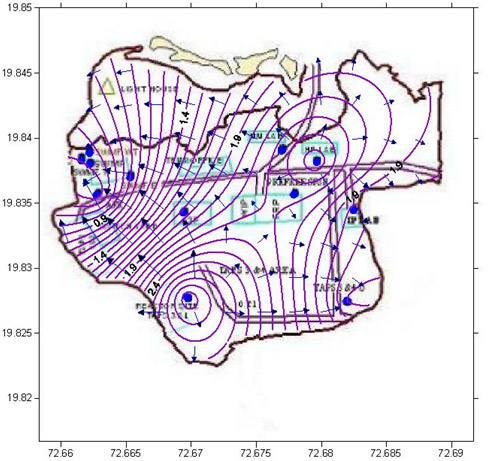
Fig.7.3:
Groundwater flow map during monsoon in TAPS