Applied Science
| Title | Aquifer characterization using advance geophysical techniques in representative geological terrains of India [AQUIM] |
|---|---|
| Participants | Shakeel Ahmed, Somvanshi, . Subhash Chandra, . N.C.Mondal, . Tanvi Arora , Sheshamma, Nagaiah, Abdul Khaleel,Rakesh, Veerababu, Pradeep, Deepak, Satish, Dhanashree, Abhijeet, Vikram, Sarah, Farooq Ahmad Dar, Tirupathi, Ramya, Ahmeduddin, Tarun, Raghavendra, Kapil, Satyajit, Rekha, Mehak , Manikandhan, Manish, Jai Prakash |
| Sponsoring Agency | CGWB/MoWR, World Bank |
Work Description:
Under the National Aquifer Mapping Programme of Govt. of India, state of the art geophysical investigation are being carried out: (1) To delineate the principal aquifers up to 200 m depth in hard rocks and 300 m depth in sedimentary areas, (2) To establish of the efficacy of various geophysical techniques under different hydrogeological conditions, and (3) To develop of a suitable methodology for geophysical investigations, as a pilot project (AQUIM) to be up-scaled for the entire country. In this flagship project, CSIR-NGRI has undertaken a pilot study for 6 areas in different hydrogeological terrains covering 1) thick alluvium overlying hard rock of Rajasthan (AQRAJ), 2) basaltic traps underlain by thick Gondwana sediments in Maharashtra (AQMAH), 3) Complex crystalline rocks of Karnataka (AQKAR), 4) thick alluvial plains of Ganga basin in Bihar(AQBHR), 5) coastal sediments of Tamil Nadu (AQTND) and 6) desert of Rajasthan (AQDRT) (Figure 2.1) representing the most of the geological formation present. The project is of two folds i.e., (1) Ground-based geophysics and (2) Heliborne geophysics. Until now CSIR-NGRI has conducted surface geophysical surveys comprising Vertical Electrical Sounding (VES), Time Domain Electromagnetic Sounding (TEM) and Electrical Resistivity Tomography (ERT) in the above six areas.
(i) AQRAJ Area
AQRAJ area of 598 km2 in parts of Dausa district, Rajasthan forms a part of Banganga basin located towards north of the east flowing Banganga River. This area represents hard rock overlain by alluvium. Thin sand and gravel form the aquifers in 80-90 m thick alluvial cover overlying hard rocks. It suffers from fluoride, iron, nitrate contaminations, salinity and over exploitation. The stage of groundwater development (SGWD) is 173%. In this pilot area, 51 VES, 73 TEM and 2 line-km ERT were conduced (Figure 2.1). The results indicate the maximum depth to bed rock around 105 m in southeastern parts. A moderately thick (15-29 m) saturated zone, the aquifer in the alluvium immediately overlying the bed rock has been delineated at most of the sites . Hydrogeophysical cross-sections prepared on the basis of VES and TEM have identified a few potential areas of deep aquifers.
(ii) AQMAH Area
AQMAH represents basaltic terrain underlain by Gondwana sediments and Archean metamorphic at some places covering an area of 360 km2 in north-western parts of Nagpur district, Maharashtra. Aquifers composed of weathered and vesicular basalts and underlying Gondwana sandstones occur at 150 to 200 m depths. In this area, 20 VES, 52 TEM and 17 line-km ERT were conducted (Figure 2.1). The ERT images exhibit clearly basaltic flow pattern lying between 30-80 m depths. Resistivity ranges, though observed low, indicate increasing trend towards south and reaches up to 400 Ω-m. Such a flow is expected to be continuous. However, observed low resistivity breaks within the ERT profile over basaltic terrain could be inferred as weak zone forming potential groundwater bearing zones.
Further, the TEM data were utilized to construct resistivity section aligned in NS following the same alignment as ERT. The TEM data is corrected for elevation and presented in Figure 2.2a. Associated ERT data pattern and inferred geological set up are also shown in Figures 2.2b & c. Likewise, the individual ERT images discussed above revealed a good correlation with TEM results.Since both the measurement is are limited to 100 m depth of investigation, basaltic flow at deeper level could not be mapped. However, both the measurements indicated relatively low order of resistivity corresponding to Gondwanas and alternate layering of low, high and low resistivity due to basaltic flows, associated with alterations and the intertrappeans. The 15 km long N-S ERT profile across the basaltic traps flanked by exposures of Gondwanas has revealed the disposition of weathered and compact basalts, their lateral continuity, the aquifer characteristics of the weathered zone and underlying vesicular basalts, that of the Gondwanas and the steeply dipping discontinuities in the basalts favorable as groundwater repositories.
(iii) AQKAR Area
AQKAR area of 376 km2 in Tumkur district, Karnataka represents Archean crystalline. The main aquifer is composed of lower weathered and fractures zones. In this area, 34 VES, 26 TEM and 13.6 line-km ERT were conducted (Figure 2.1). The saturated part of the weathered zone forming the shallow aquifer and the deeper saturated fracture zones could be identified from the VES and TEM results. The ERT has been effective in identifying areas with thickening of weathered zone and the aquifer in it. The thickness of groundwater saturated zone map was prepared for the month of February 2013 by subtracting the depth to water level obtained from CGWB from the VES inferred depth to bed rock. It was found that the thickness of saturated zone generally varies from 0 (over the exposed hillocks) to 20 m and higher thicknesses were observed at few points. A major part of the present study area is occupied by negative values indicating that the depth to water level is below the bed rock depth. In such areas the weathered zone is almost dry and water is tapped from the fractured zones within the bedrock. Inferred bed rock levels were considered as reference line (‘0’) and with respect to that, the saturated thickness map was prepared with (+) water level above the bed rock and (-) water level below the bed rock. The attempt has shown clearly the areas of over-exploitation and the areas with moderate to less groundwater potential. Preparation of such maps for pre- & post-monsoon periods may attribute to identification of recharge areas over this pilot area.
(iv) AQBHR Area
AQBHR area of 521 km2 in Patna district, Bihar in Middle Ganga Plain (MGP) represents a thick sequence of Ganga alluvium resting over the pre-Tertiary formations holding a multi-aquifer system. In this pilot area, 50 VES, 58 TEM and 19 line-km ERT were conducted (Figure 2.1) with the main objective of delineating different aquifer stages up to the depth of 300 m and beyond. The deep VES were carried out for the first time revealed the presence of resistive basement in the southern part at about 600 m depth. It is also able to identify different stages of aquifer depositions to the depth beyond 300 m. It's correlation with exploratory bore well lithology yielded good similarities making VES as a potential tool in aquifer mapping. Apart from the areal delineation of aquifer system, the ground geophysical surveys identified some lithological discontinuity in the study area which could be further established through other geophysical methods. This will form an important aspect of understanding the hydraulic connectivity of aquifers regionally in alluvium area. Few cross-sections at the selective sites were prepared to understand the aquifers extension and its geometry. The behavior of sub-surface geoelectrical responses enabled in identifying the deepening of aquifers towards northern part of the study area. Sometime the VES along was not resolved clay zone having thickness around 10 m sitting below around 100 depth acting a barrier between the first and second principal aquifers, But the upper boundary of this clay layer was demarcated clearly with the aid of Ground TEM data. It was also demonstrated that the depth of first principal aquifer could be delineated easily using the TEM data in the entire pilot area. ERT is found to be a good tool of exploration in palaeo-channels which in general exist in the major river basins and also able to map top of the first principal aquifer and extended down to 100m (bgl) using 48 electrodes with 10 m spacing.
(v) AQTND Area
AQTND area of 234 km2 falls in parts of Cuddalore district, Tamil Nadu. It represents alluvium underlain by thick coastal sediments of Tertiary and Cretaceous age resting over the crystalline basement. In this area, 20 VES, 15 TEM and 10.8 line-km ERT were conducted. The sub-surface deeper response of the soundings observed on the northern part is distinctly different from the response of the other soundings observed in the southern part. The unique responses of these two segments indirectly reflect the textural nature of deeper sediments forming different geo-electric layers. The behavioral pattern of sounding curves able to distinguish Arenaceous and Argillaceous facies of sediments below the laterite cap rock. The TEM results were compared with a litholog data of nearest exploratory well near NLC (Figure 2.3). Lithology has been inferred from the interpreted layer parameter of the TEM conductivity data. The interpretation up to the depth of 160 m yielded 6 layers of alternative sand and clay formation with associated lignite-clay beds. The comparison of lithology observed from the bore hole and the interpreted layer parameters shows good correlation. Although the lignite has small thickness, the associated clay layer helps in delineating the composite layers. Further the TEM result is very effective in differentiating the saline-fresh aquifer interface in the east and the lignite beds associated with clay beds in the west. The survey carried out at several locations across the coast-line; clearly indicate the depth and thickness of shallow fresh water aquifer zone. The 2-D resistivity tomography also clearly mapped the aquifer salinity influenced by the sea incursion to a depth of 60-80 m near the coast in this area.
(vi) AQDRT Area
AQDRT area of 675 km2 lies in Sam Panchayat Samiti (block), Jaisalmer district in Western Rajasthan. It forms a part of Western Arid Plain. It represents a typical area in Thar desert with a pile of dry Aeolian sand, alluvium, sandstone and limestone resting over crystalline basement. This area is being affected by groundwater salinity and falls in critically exploited category. Fresh water aquifers are in the alluvium underlying the desert sand. The thickness of desert sand and alluvium varies from 10 to 100 m. The underlying sandstone and limestone hold thick potential aquifer. Groundwater is brackish to saline nature at some places.
In this pilot area, only 8 TEM were conducted on an experimental basis starting from Sanu village to Ranao along Ramgarh town (Figure 2.1). The TEM result is found quite responsive to the subsurface resistivity distribution in this desert area. A hydrogeological section (SN-direction) was prepared based on the TEM results, whichindicates limestone at a depth around 63 m in the south (at DT1). The middle portion located at Ramgarh town shows different hydrogeological unit with complete contrast in conductivity as an indicative of saline water zone. A huge pile of dry Aeolian sand dunes underlain by saline water zone are encountered in the northern portion (at DT9). The interfaces between dry sand and underlying saline water zone and the compact formation could be delineated to depths beyond 100 m.
Thus an integration of surface geophysical methods (i.e., VES and TEM) has clearly revealed the effectiveness in jointly minimizing the ambiguities inherent in these techniques. The TEM sounding being quite fast in field operation and requiring less surface spread could be the best alternative and supplementary under favourable hydrogeological conditions. The TEM sounding could be effective in delineating the conductive clay layers. The effectiveness of long ERT profile and the application of laterally constrained inversion (LCI) could be established in delineating the regional subsurface hydrogeological setup. However, the terrain wise establishment of geophysical methodology and its up-scaling for the NAQUIM programe will be finalized after completion of the remaining surface geophysical surveys and the heliborne surveys.
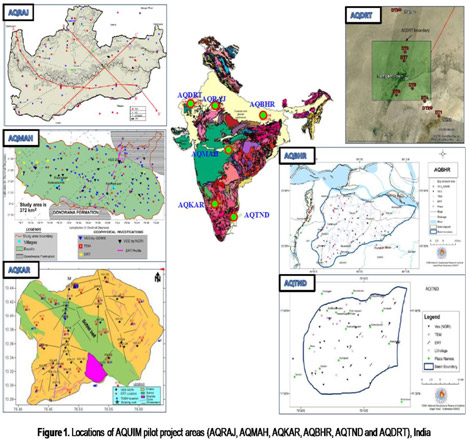
Fig.2.1: Locations of AQUIM pilot project areas(AQRAJ, AQMAH, AQKAR, AQTND and AQDRT), India
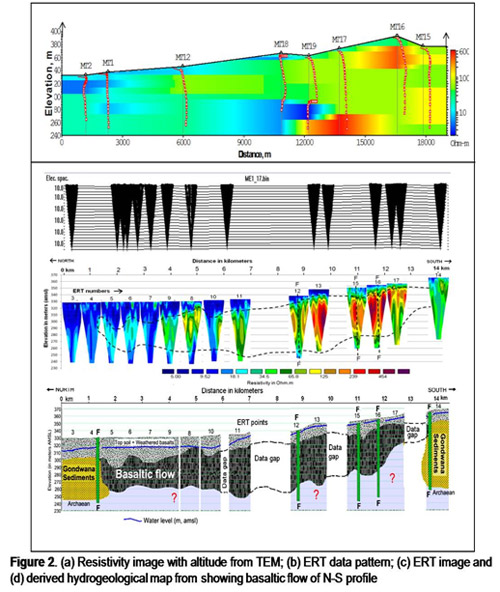
Fig.2.2(a):
Resistivity image with altitude from TEM;(b) ERT data pattern;(c)ERT image and (d)derived hydrogeological map from showing basaltic flow of N-S profile
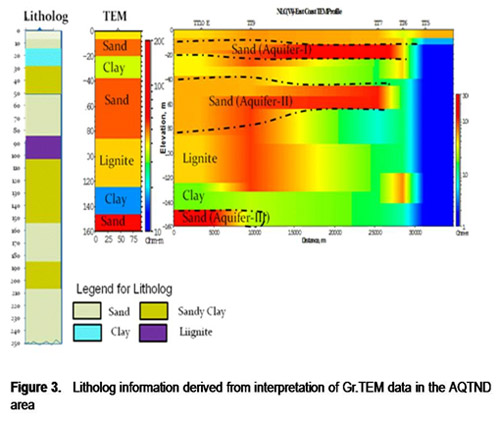
Fig.2.3:
Litholog information derived from interpretation of Gr.TEM data in the AQTND area